
The Market Crash Is Underway And Cannot Be Stopped?
There was an intriguing headline on Bloomberg today.
Here it is: Investors Hate Leverage Like It’s 2009, According to This Metric.
Here's the main chart of the Bloomberg pure leverage portfolio.
(Click on image to enlarge)
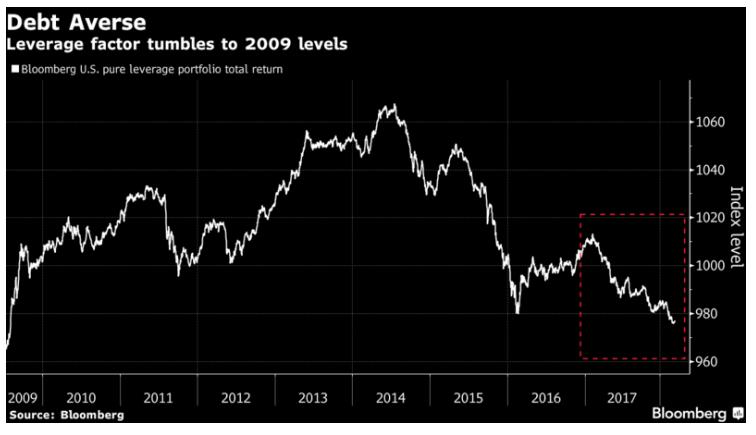
The underlying jist of the article is this,
- Investors have ditched stocks of companies that are highly leveraged,
- just like back at the height of the last crash.
- So the market is still very attractive because investors are concentrating on companies with very healthy balance sheets!
There fore you should just shut up and BUY!
I beg to differ here!
Have investors really gone off leverage?
How about we look at the figures for total consumer credit in the U.S form the federal reserve.
Total Consumer Credit Owned and Securitized, Outstanding
(Click on image to enlarge)
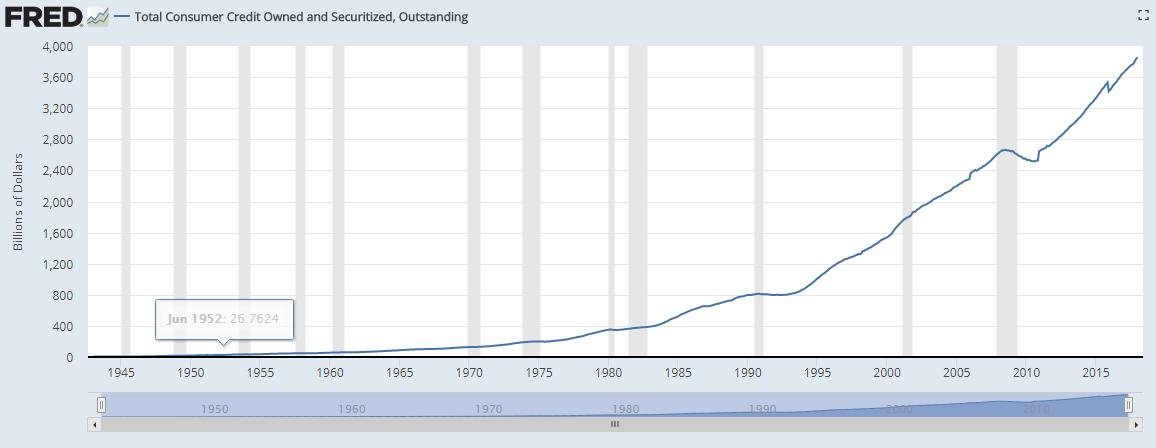
Does this look like investors have gone off leverage in any way whatsoever??
I dont think so.
How about NYSE margin debt figures, which again made new all time highs in Janurary.
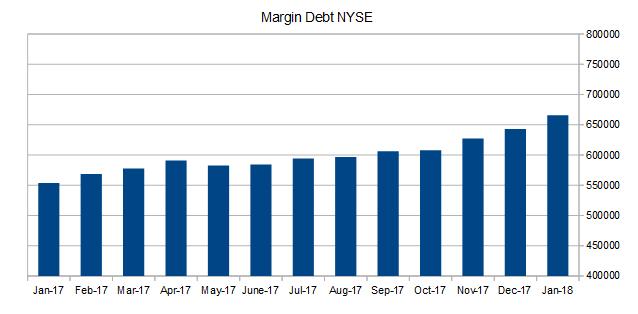
No, We still love leverage as far as I can see!
Here is a recent statement issued by FINRA, the U.S financial regulation authority.
In light of these recent margin statistics, we are re-issuing this alert because we are concerned that many investors may underestimate the risks of trading on margin and misunderstand the operation of, and reason for, margin calls. FINRA is just covering their backs, but at least someone is sitting up and taking notice, but I fear this is too little too late. The consequences for this debt binge are going to be catastrophic. And no amount of massaging from the financial media is going to change the fact that a crash is now underway, and cannot be stopped.
Take cover while you still can.
UPCOMING RISK EVENTS:
USD: Core Retail Sales m/m, PPI m/m, Retail Sales m/m, Crude Oil Inventories.
EUR: ECB President Draghi Speaks,
GBP: N/A.
JPY: N/A.
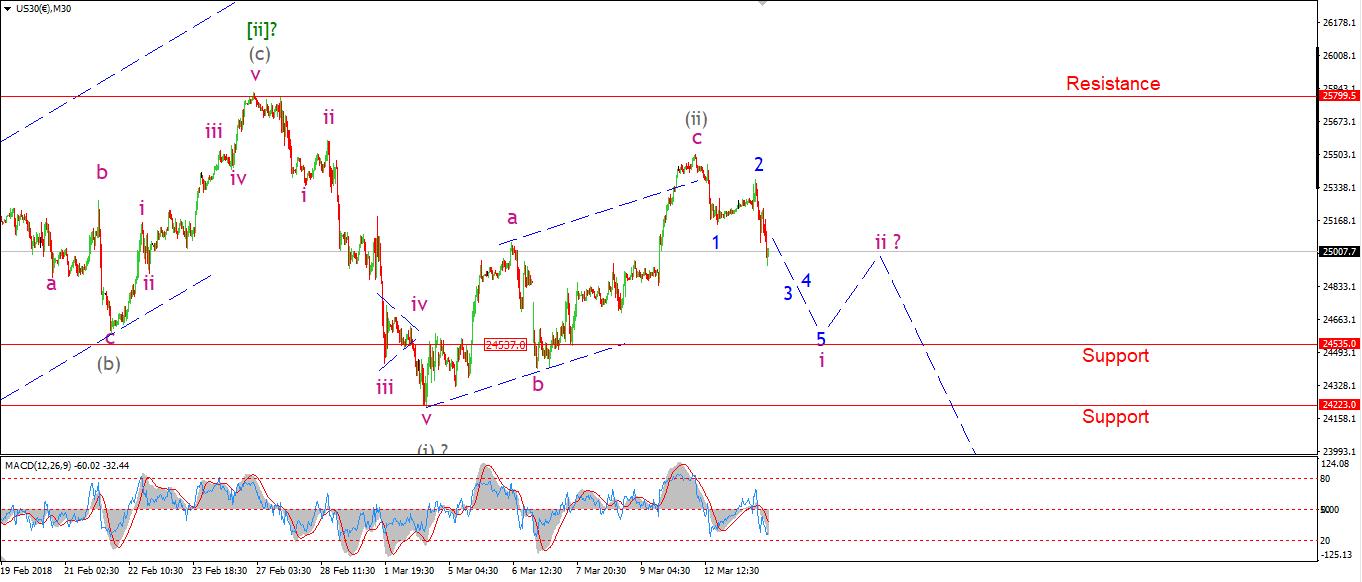
DOW JONES INDUSTRIALS
30 min
(Click on image to enlarge)
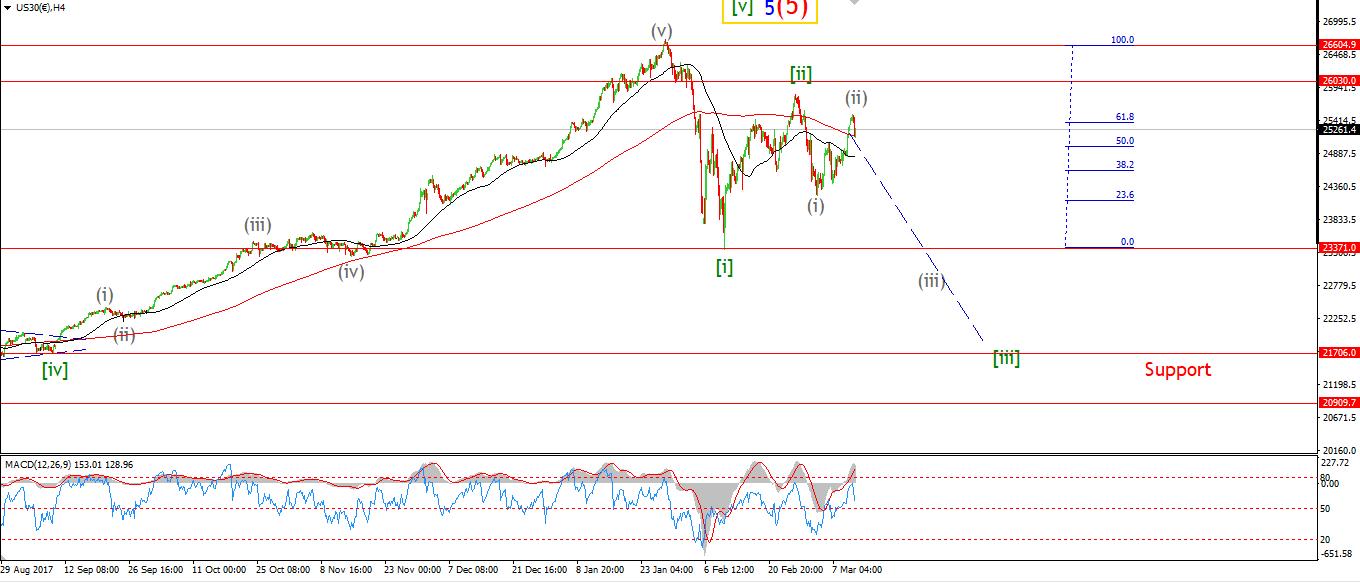
4 Hours
(Click on image to enlarge)
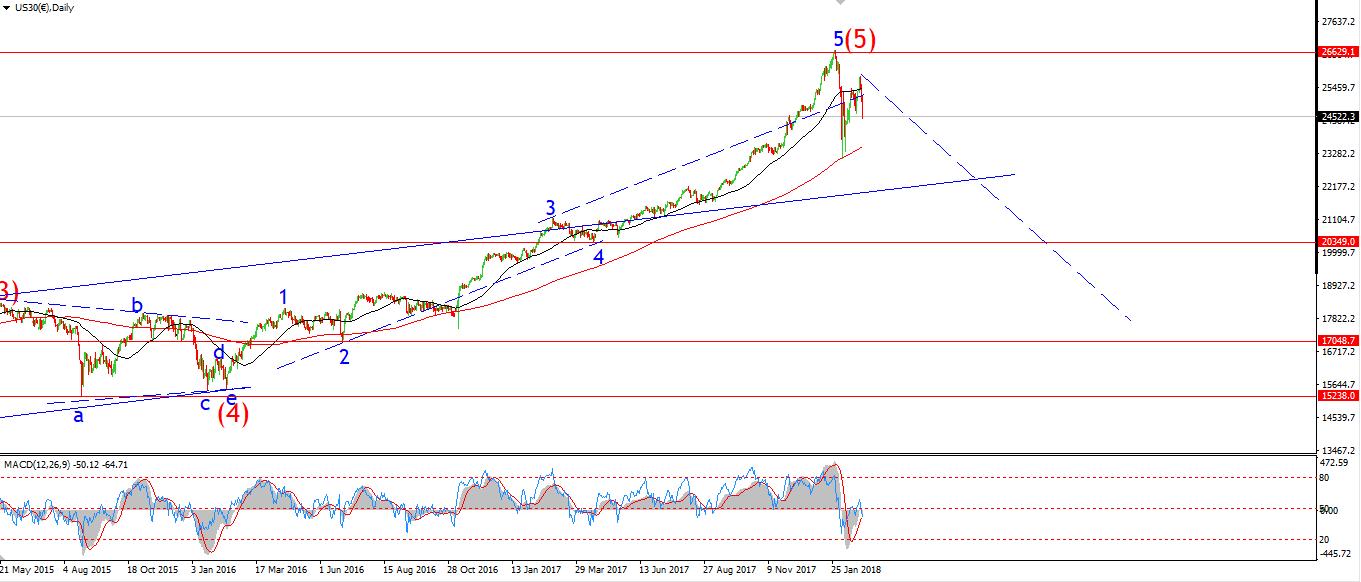
Daily
(Click on image to enlarge)
My Bias: market topping process completing
Wave Structure: Impulsive 5 wave structure, topping in an all time high.
Long-term wave count: topped in wave (5)
The Dow broke down through 24991 today. This is the high of the previous wave 'a' pink on the short-term chart. The next major confirmation level lies at 24535 cash, which is the previous wave 'b' pink. A break of that level will seriously favor the bearish view from this point on.
I have shown a developing five wave pattern to the downside in wave 'i' pink. This should be followed by a three wave correction in wave 'ii' pink, and that will complete three degrees of bearish Elliott wave signals.
The bearish signals are lining up ominously for stocks right now!
Tomorrow, the declines should continue in wave 'i' pink. Initial support lies at 24535.
Want to know the next big move in the Dollar, GOLD and the DOW?
Check out our membership plan over at ...
more

