The Longer-Term Trend - Saturday, June 17
Some comments from Mike Burk's weekly letter regarding this past week. I highly recommend reading Mike Burk every Saturday.
"New lows reached uncomfortable, but not threatening levels."
"The market has been doing a pretty good job of following the seasonal pattern for the 1st year of the Presidential Cycle. The seasonal pattern for the coming week reveals summer doldrums."
My indicators tell me that there is a pretty good chance of a downturn soon, but I have no idea how deep or serious the decline will be. And, as a reminder, there have been a several indications of a downturn since the election that turned out to be just a blip in the uptrend.
With the above comments in mind, I am being cautious. On Friday, I raised a little cash and entered into a couple very small short positions. I will adjust based on the behavior of the market. I will pay particular attention to the number of new 52-week lows, and the ability of indexes to hold above their 50-day moving average.
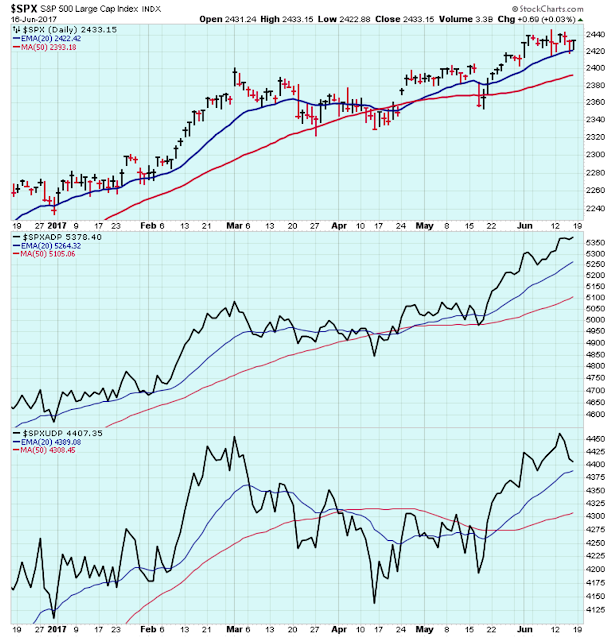
Below is a chart of the market basics. The S&P is above the 20-day, and the 20-day is above the 50-day. And the lower two panels show similar patterns. Nothing to complain about in this chart except for maybe a bit of short-term volume weakness.
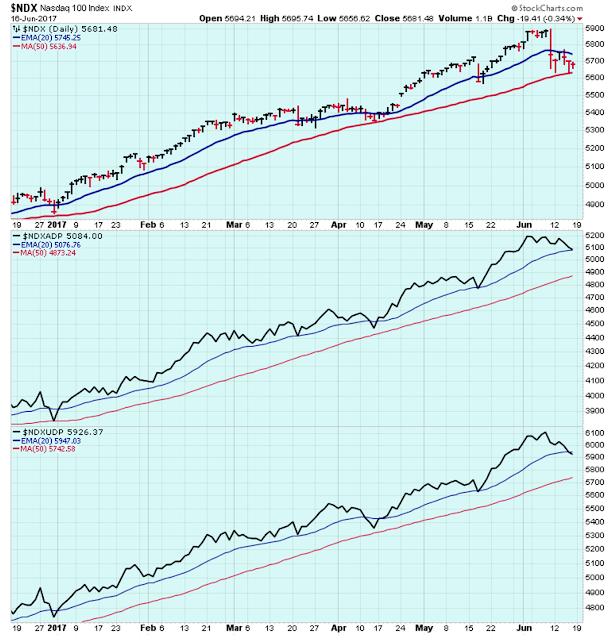
Here is the same chart format but for the NDX. This is a very clean looking chart despite the recent Tech weakness. Let's not get too negative towards the NDX as long as prices holds above the 50-day.
So that makes two fairly good looking charts. Why be cautious?
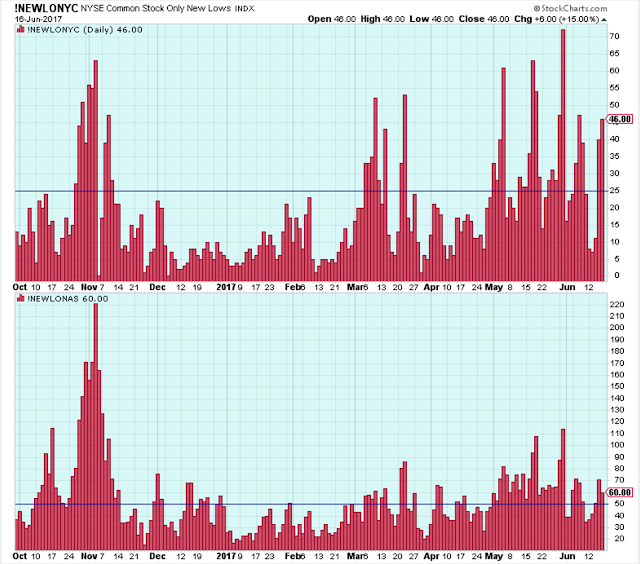
This is the chart that has me a bit worried. The SPX is pushing up towards new highs while the level of new 52-week lows is elevated. That is all you have to say to me to get me worried that we have the potential for a pullback. But, as Mike Burk points out, new lows aren't elevated enough to be selling aggressively.
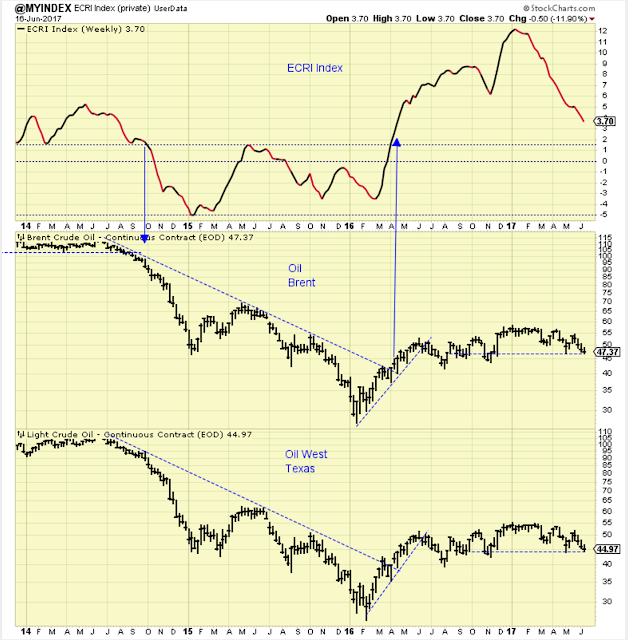
The ECRI index also has me concerned. At the level, there is enough economic growth to support stock prices, but this index has been headed lower all year and it needs to stop declining soon or it means growth is too weak.
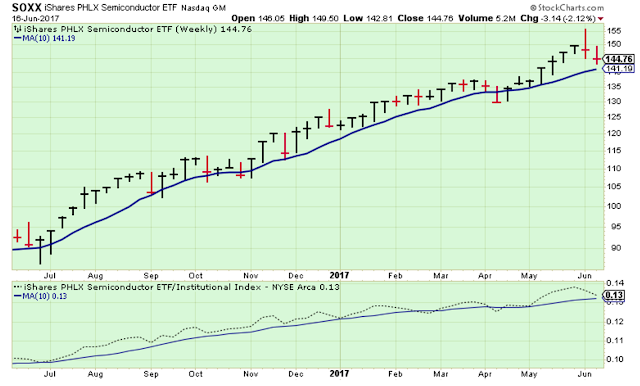
Oil prices are very important. A break below the support levels could start to unnerve the market that is already concerned about the declines in Tech and Retail.
This is another critical chart. A break below the 50-day raises the alert level from caution to warning.
Outlook
The caution flag is waving.
The long-term outlook is positive.
The medium-term trend is up. Overdue for a correction.
The short-term trend is up as May-24. Looking for signs that the next downturn is starting.
Disclaimer: I am not a registered investment advisor. My comments above reflect my view of the market, and what I am doing with my accounts. The analysis is not a recommendation to buy, ...
more


Thanks for sharing