
The Kingdom Offers Less Oil
While the media remains fixed on supply, the rest of the financial complex is prepared elsewhere. On Monday, Saudi Arabia announced what the mainstream has been waiting for (and often blatantly demanding) since the summer “rebound” faded into August liquidations. Given the mythical status of Saudi supply, this was the one country thought to be the only possible savior.
Crude prices slumped, rebounded sharply and then lost their gains all in the space of a couple of hours Monday after Saudi Arabia — the world’s largest export of petroleum — said it would cooperate with all oil producing countries to help stabilize the oil market…
Crude prices staged a sharp turnaround on Monday’s reports, with Brent trading at around $45 afterwards and light crude at just under $42. The commodities have since pared some of those gains: down 20 and 60 cents respectively. Prices had previously been down on the day and, last week, WTI crude fell below the psychologically important $40 mark for the first time since August.
Yet, now a few days later, oil is practically unchanged despite the possible alteration in oil supply. Domestic or global, the word “glut” is most often used to describe the commodity situation as if it were exhaustive when there isn’t any evidence it even applies here or elsewhere. The Saudi announcement is simply the latest stinging effect that demands proper appreciation of the real imbalance.
US fundamentals continue that demonstration, as oil production endures under reduction after peaking earlier this year. Despite that reversion in supply, oil stocks (inventories) have once more surged back to 80-year highs and leaving little doubt as to the cause of all the world’s oil problems (only where orthodox economics has so fully supplanted common sense are low oil prices to be so unwelcome). This week’s US EIA update showed yet another increase in inventory, albeit small, making it nine consecutive weekly builds and eleven of the past thirteen – dating back to the week of August 21.
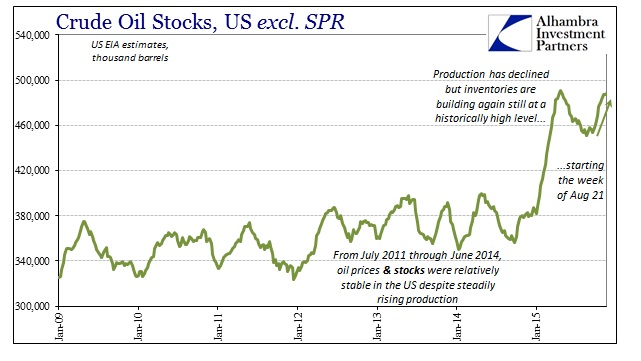
This is all merely the continuation of the pricing dynamics that were totally and completely obvious even when oil first started its “transitory” deviation. Both US and global production were perfectly predictable and had been for years; the US production trajectory was nearly a straight line. While production was building, oil inventory was not and oil prices thus remained corrosively elevated.
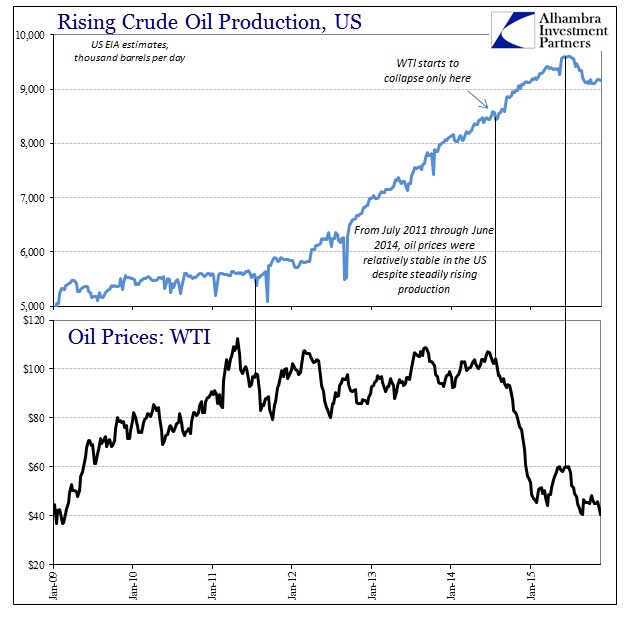
It wasn’t until “something else” changed in late June/early July 2014 that saw oil prices collapse to which there has been no shift in that fundamental status; production didn’t even change until long afterward, continuing its straight-line predictability for still months. This is so ridiculously simple that only blind ideology could explain its repeated omissions. The “dollar” changed the complexion of oil price dynamics as it was roiled in internal eurodollar decay (and amplification of that decay), which by count of the continued massive inventory and now production declines has proved to be the correct predictor of oil demand; and thus economic demand more broadly and globally.
The price of WTI (and Brent) declined sharply weeks before the explosion in oil stocks shown above, driven by contango as the agent of “enforcing” this exchange between finance and physical commodity clearing. That would be a solid interpretation of economic fundamentals even if it were just crude oil undertaking that process, but it is near-universal in general commodities and more so in industrial commodities.
Copper barely avoided relinquishing $2 Monday for the first time since economic demand was peeking out of the worst of the Great Recession. The price dynamics in copper are as crude oil, with “dollar” financing combining with physical clearing balances to project economic expectations into the price.
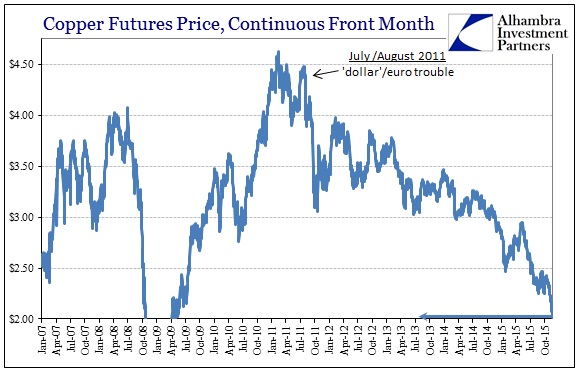
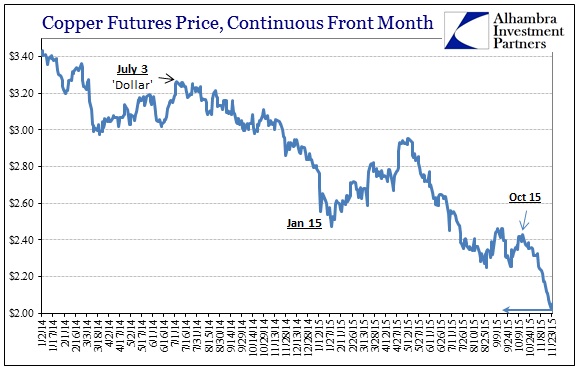
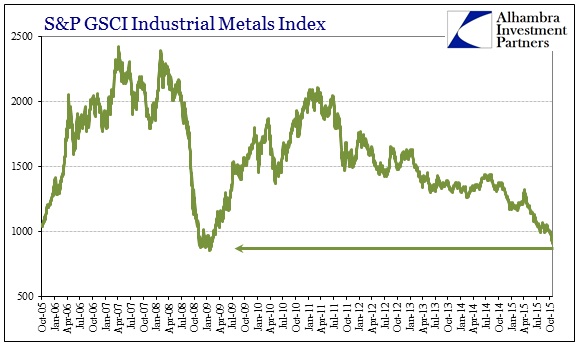
Overall industrial metals, as reported in the S&P GSCI Industrial Metals Index, have already sunk alarmingly close in comparison to the very depths of the Great Recession. Even though commodity prices have been falling since the middle of 2011 (“dollar”) the acceleration of that devaluation in the middle of 2014 (also “dollar”) is relevant and stunning. Given the economic behavior of both US consumers and thus related Chinese industrial production and capacity, there is simply too much here, especially timing, in and of the “dollar” to instead go searching the sand to desperately provide an oil supply answer to the world’s stubborn and continuing economic woes.
To that end, the “dollar” continues to be highly bearish and thus expresses more difficulties with overall “demand” still ahead. The eurodollar curve itself has been altered by the latest FOMC “hawkishness” in contrast to its prior “dovishness” but that has been limited, in fact, to only the front end of the curve. While there was some incomplete overall steepening in the aftermath of the September FOMC decision, especially following the September jobs report that seemingly confirmed in perception that monetary stance, it was and has been surrounded by bearish flattening both before and thereafter.
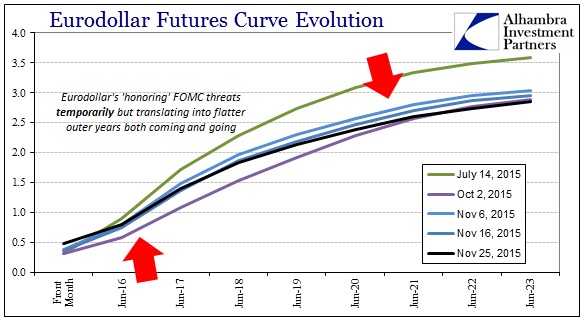
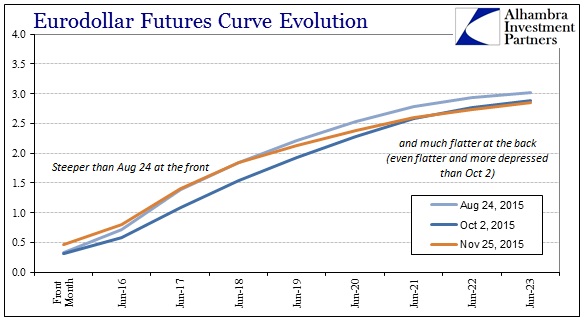
In fact, the curve now shows exactly that impression revealed quite clearly in relation to both August 24 and October 2 (September payrolls). Where there was some steepening into November, it was both minor and temporary. That suggests, strongly, that the money markets were at first slightly hopeful that a further pause in monetary intentions (lower for longer) might offer even some small window of hope to get out of this growing economic mess. However, that economic mess continues to be the baseline expectation (with, as everything above shows, good reason) leaving monetary policy in the unenviable (but thoroughly appropriate) position of convincing the money markets that it can only make this bad, financially imbalanced situation worse. That the curve is now flatter in the outer years than both August 24 and now even October 2 is unambiguous in its agreement on that point.
The inflection at and outside the policy window on the eurodollar curve in early November tells of the closing opportunity to escape the “dollar’s” ongoing downdraft. In that respect, it seems as if we have reached the point of self-reinforcement, where negative impressions in the financial internals become actual, physical imbalances that only further suggest more negative financial impressions to at some point play out as even more negative and bearishly imbalanced physical fundamental points. Since these processes are not mere academic exercises but real world intrusions upon the actual economy, the “dollar” is and becomes, again, the truest form of demand projection.
As discussed yesterday, the PBOC itself could not get around this fact (and still cannot, as its balance sheet update proves) so it isn’t surprising that Saudi Arabian oil promises would not either. Those production cuts will come, they must come, but that does not represent any actual change; in fact, that is still part of what the “dollar” is meaning in economic projection, expecting that those production cuts will eventually and at some point become a full part of that cascading global economic baseline.
Disclosure: None.


Petroleum is the only commodity that is sensitive to war issues. Things are heating up in the middle east. Lower oil prices are a goal of western policy, but are by no means a done deal.