
The Future Via Futures And CoT For The Coming Week
Following futures positions of non-commercials are as of June 26, 2018.
10-year note: Currently net short 355.3k, down 4.1k.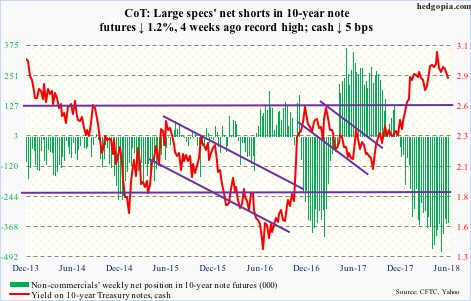
Core PCE – the Fed’s favorite measure of consumer inflation – rose 1.96 percent year-over-year in May. This is as good as two percent. The last time it rose with a two handle was in April 2012. Core inflation has been trending higher since last September. This includes core CPI, which is already past two percent.
The FOMC dot plot which in the meeting this month forecasted two more hikes this year – four in total – is looking like it is on to something. Except there is that reaction from bond vigilantes. Friday, 10-year Treasury yields (2.85 percent) reacted to the core PCE print with pretty much a yawn, as if warning the central bank not to get too excited by the recent uptick in inflation. Ditto with the 10s/2s yield curve, which at 31 basis points Wednesday was the lowest since August 2007.
30-year bond: Currently net short 10k, up 1.2k.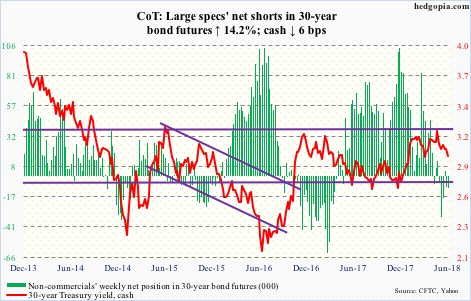
Major economic releases next week are as follows. (US Markets are closed Wednesday. Happy Independence Day!)
The ISM manufacturing index for June is scheduled for Monday. May was up 1.4 points month-over-month to 58.7. February’s 60.8 was the highest since 61.4 in May 2004.
Revised durable goods data for May, as well as non-durable, will be published Tuesday. Preliminarily, orders for non-defense capital goods ex-aircraft – proxy for business capex plans – in May rose 6.1 percent y/y to a seasonally adjusted annual rate of $67.9 billion.
Thursday brings the ISM non-manufacturing index (June) and FOMC minutes for the June 12-13 meeting.
Services activity in May rose 1.8 points m/m to 58.6. January’s 59.9 was the highest ever (data only goes back to January 2008).
June’s employment numbers are reported Friday. Non-farm payroll in May increased 223,000.
Crude oil: Currently net long 677.9k, up 47.8k.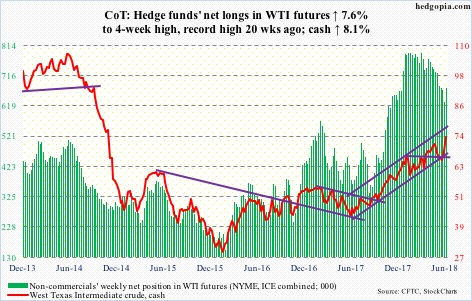
Last week’s weekly bullish engulfing candle on spot West Texas Intermediate crude ($74.15/barrel) was followed by another long-bodied solid black candle. Post-OPEC (plus Russia, among others) decision last Friday to boost production from July by one million barrels/day, traders have fallen over each other to own oil. For the week, WTI rallied another 8.1 percent.
WTI has traded within an ascending channel for the past one year. The upper bound gets tested around $76. Friday’s intraday high was $74.46, which was the highest since November 2014.
Wednesday’s EIA report, for the week of June 22, likely did not hurt bullish sentiment.
For the second week, crude production was unchanged at 10.9 mb/d. Refinery utilization rose another eight-tenths of a percentage point to 97.5 percent – a 13-year high. Crude stocks dropped 9.9 million barrels to 416.6 million barrels – a six-month low.
Gasoline stocks, however, rose 1.2 million barrels to 241.2 million barrels. As did distillate stocks, up 15,000 barrels. Crude imports rose, too – by 114,000 b/d to 8.36 mb/d.
E-mini S&P 500: Currently net long 197.2k, up 8k.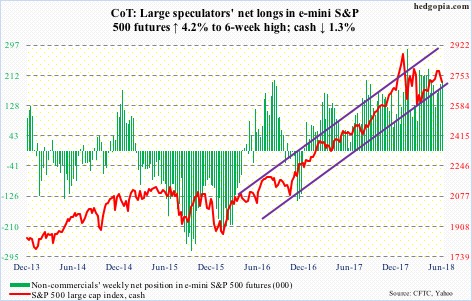
Thursday’s intraday drop to 2691.99 on the cash (2718.37) just about tested a rising trend line from February, which was defended. Although until Wednesday, flows were very negative. In the week ended that session, SPY (SPDR S&P 500 ETF) lost $4.2 billion, IVV (iShares core S&P 500 ETF) $644 million and VOO (Vanguard S&P 500 ETF) $10 million (courtesy of ETF.com).
In the same week, US-based equity funds (including ETFs) lost a whopping $20 billion (courtesy of Lipper.com). For whatever it is worth, this was the largest outflow since early February, when stocks bottomed. In the latest week, AAII bears were 40.8 percent. Arguably, there is a mini-panic out there. On the daily chart, the S&P 500 has room to rally. Medium term, though, the weekly chart has room to go much lower. Near term, 2740s is the one to watch. Both Wednesday and Friday, intraday attempts to rally were aggressively sold at that level, closing out the week on the 50-day moving average.
Euro: Currently net long 33.9k, down 2.2k.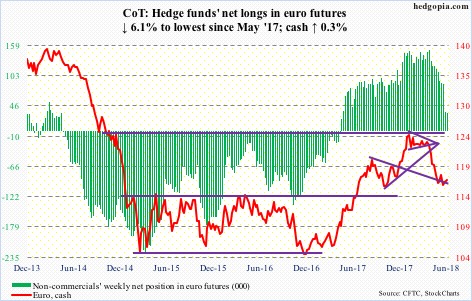
The cash ($116.94) continued to test support at $114-115. After going sideways in a rectangle for nearly two and a half years, the euro broke out of this price point last July. It subsequently rallied to $125.37 in January this year, where it got repelled by a falling trend line from April 2008.
Last week, non-commercials reduced their net longs by a massive 59.1 percent, but the euro rose 0.4 percent anyway. This week, they continued to cut holdings, and the currency managed to inch up 0.2 percent, with a weekly hammer. Bulls should be heartened by this.
Gold: Currently net long 76.7k, down 19.8k.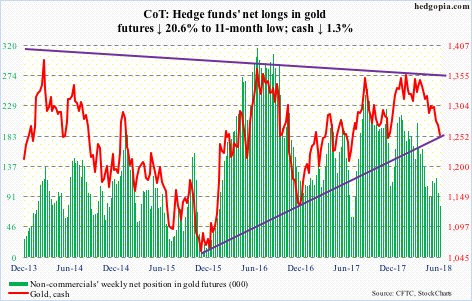
After peaking at $1,923.70 in September 2011, the cash ($1,254.50/ounce) bottomed at $1,045.40 in December 2015. Since then, the trend has been higher, although gold has been persistently rejected at $1,360-70. A trend line from that low was tested this week – successfully thus far. The metal fell Thursday to an intraday low of $1,247.20.
Gold is severely oversold on the daily chart, with the daily RSI of sub-23 Thursday. This week, it continued to fall all along the rapidly dropping daily Bollinger band. Flows continue to be negative. In the week through Wednesday, IAU (iShares gold trust) lost $88 million and GLD (SPDR gold ETF) $288 million (courtesy of ETF.com). Of late, non-commercials have been cutting back net longs. Perhaps more worryingly for gold bugs, gold has not rallied even when risk-off sentiment rises.
With all that said, odds favor a rally here. In the event of one, nearest resistance lies at $1,280-ish, followed of course by $1,300-plus.
Nasdaq 100 index (mini): Currently net long 13.5k, down 9.3k.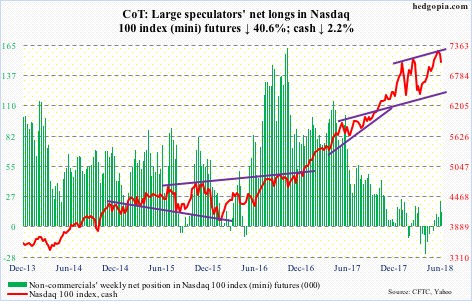
Thursday, bulls defended the 50-day on the cash (7040.80). It has been above that average since May 4. Between this, the Nasdaq 100 rose to a new all-time high of 7309.99 on June 20, right before quickly dropping nearly five percent intraday in the next six sessions.
In the week to Wednesday, flows were slightly negative at QQQ (PowerShares QQQ ETF), losing $39 million, following inflows of $1.6 billion in the prior week (courtesy of ETF.com).
The daily chart is oversold, but medium term it is hardly all-clear. Weekly momentum indicators have room to continue lower. What happens around 7100-30 can dictate near-term action. Bears can get active around there. Else, a mini-squeeze can result. Mid-June, short interest on XLK (SPDR technology ETF) surged 51.5 percent period-over-period to a five-and-a-half-month high; similarly, QQQ’s jumped 31 percent p/p to a three-and-a-half-month high.
Russell 2000 mini-index: Currently net long 62.1k, down 5.4k.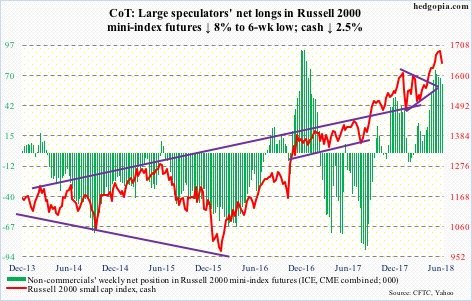
After a quick 4.6-percent intraday drop since peaking at 1708.10 on June 20, the cash (1643.07) attracted some bids Thursday. The Russell 2000 made an intraday low of 1630.06 in that session. Does this qualify as successful breakout retest? Mid-May, the index broke out of 1610-15.
At least leading up to this, flows were mixed, with IWM (iShares Russell 2000 ETF) in the week ended Wednesday losing $217 million and IJR (iShares core S&P small-cap ETF) attracting $325 million (courtesy of ETF.com). Both bulls and bears are in the confusion camp. Barring one period in the past four months through mid-June, IWM short interest has hovered between 84 and 85 million.
As things stand, at least on this try, bulls likely do not lose 1610-15. The 50-day lies at 1626.03. Medium-term is another matter. The weekly chart remains grossly overbought.
US Dollar Index: Currently net long 18.2k, up 154.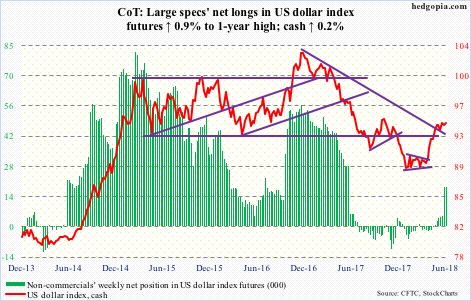
Dollar bulls continue to hammer on 95 on the cash (94.35), which have gone on the past five weeks. A breakout here would be bullish if they can force one. But the fact that it is yet to occur suggests this is also a level where sellers are active. The daily chart is looking to unwind overbought condition. Bears would gain the upper hand if they push the US dollar index below 94.
VIX: Currently net short 49.8k, down 7.8k.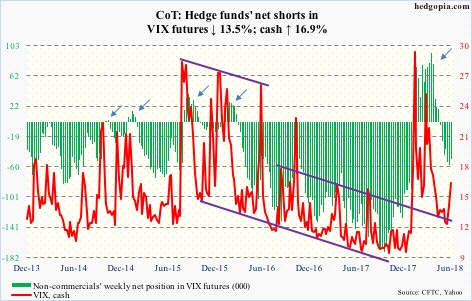
No sooner did VIX (16.09) approach 20 (rose to 19.61 intraday Monday) than volatility sellers came out of the woodwork. This mimicked the action on May 29 when VIX rose to 18.78 intraday, before dropping. Near term, VIX can head lower.
The VIX-to-VXV ratio ended the week at .94. But intraday Monday when VIX experienced that short spike the ratio rose as high as 1.03, which is elevated enough to begin to unwind, in which case premium comes out of VIX faster than VXV. This is bullish for equities.
With that said, elsewhere in the options market, sentiment remains nearly effusive. The 21-day moving average of the CBOE equity-only put-to-call ratio dropped to .56 Tuesday, before rising a tad, to .568 by Friday. This is very low, and needs to unwind. As the ratio heads higher, equities tend to come under pressure.
This suggests any rally in equities will be short-lived.
Disclaimer: This article is not intended to be, nor shall it be construed as, investment advice. Neither the information nor any opinion expressed here constitutes an offer to buy or sell any ...
more

