
The Dow Jones Transportation Average …A Bull Market Since The 1929 Crash
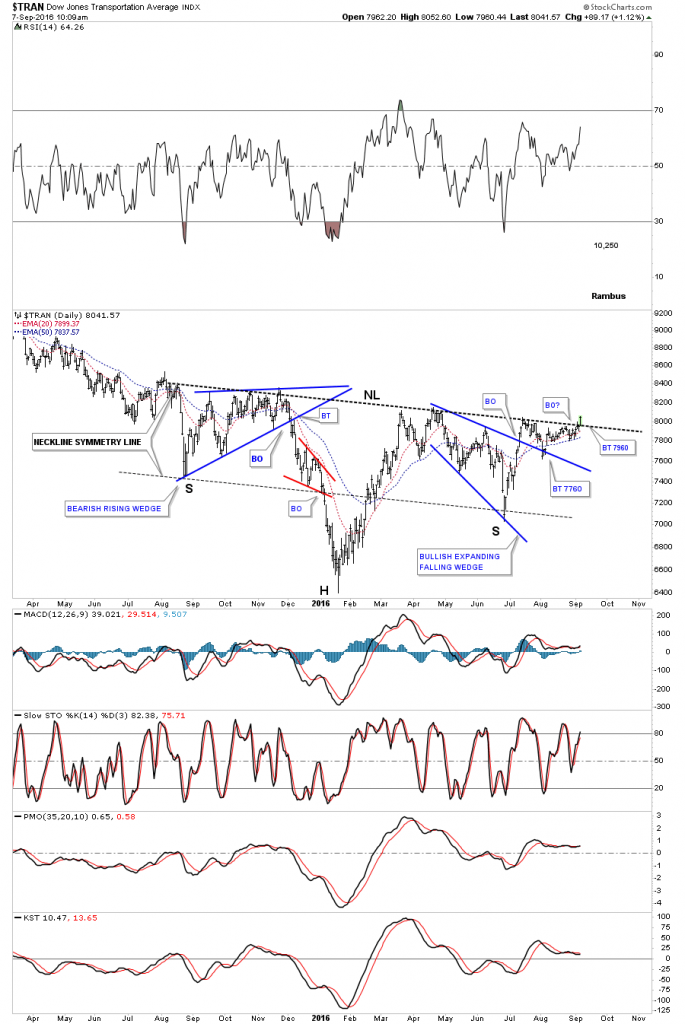
Today we are getting another big piece of the puzzle in regards to the bull market in equities. Back in July of this year the Transportation average broke out of the blue expanding falling wedge pattern and rallied up to the neckline of a big H&S consolidation pattern. At the time I said it was a positive move even if we seen the price action back off from the neckline. That backing off told us the neckline was hot and to be respected. I also said we could see a ping pong move between the top rail of the expanding falling wedge and the neckline, which we got. Today we’re finally getting the breakout move above the neckline. Folks this is a big deal IMHO.
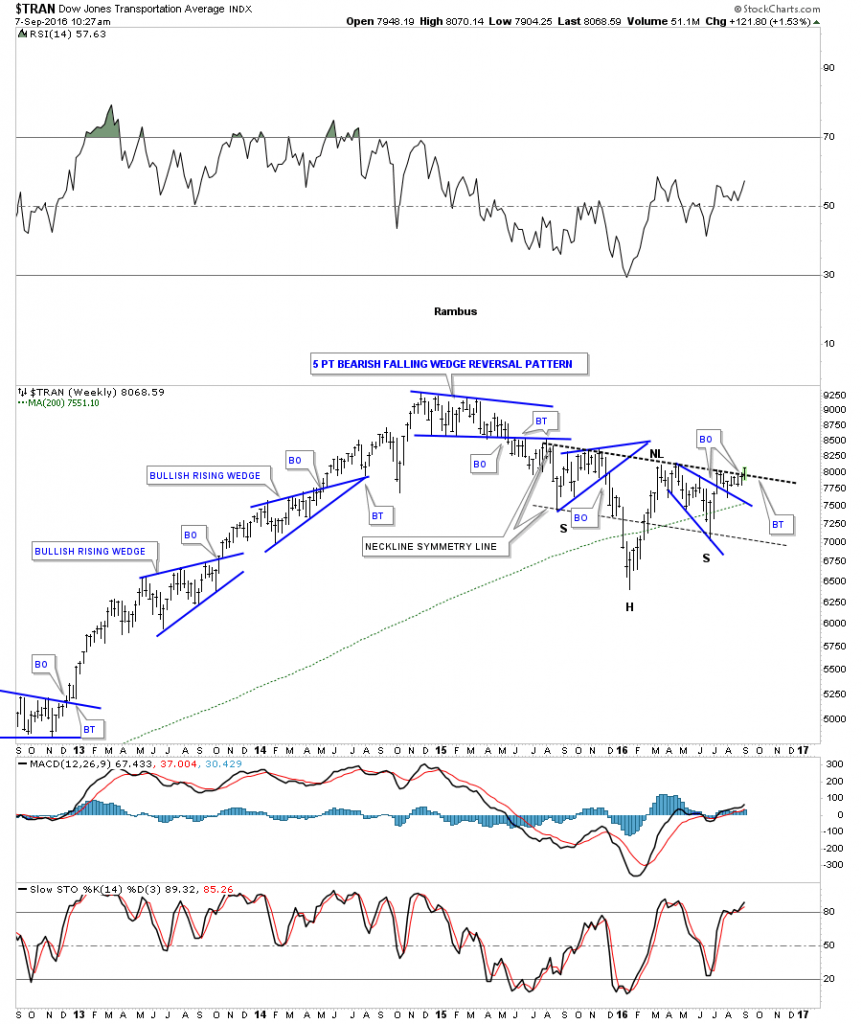
The weekly chart shows the very symmetrical H&S consolidation pattern. Note the two blue bullish rising wedges that formed in the last major impulse move up which told us the move was very strong.
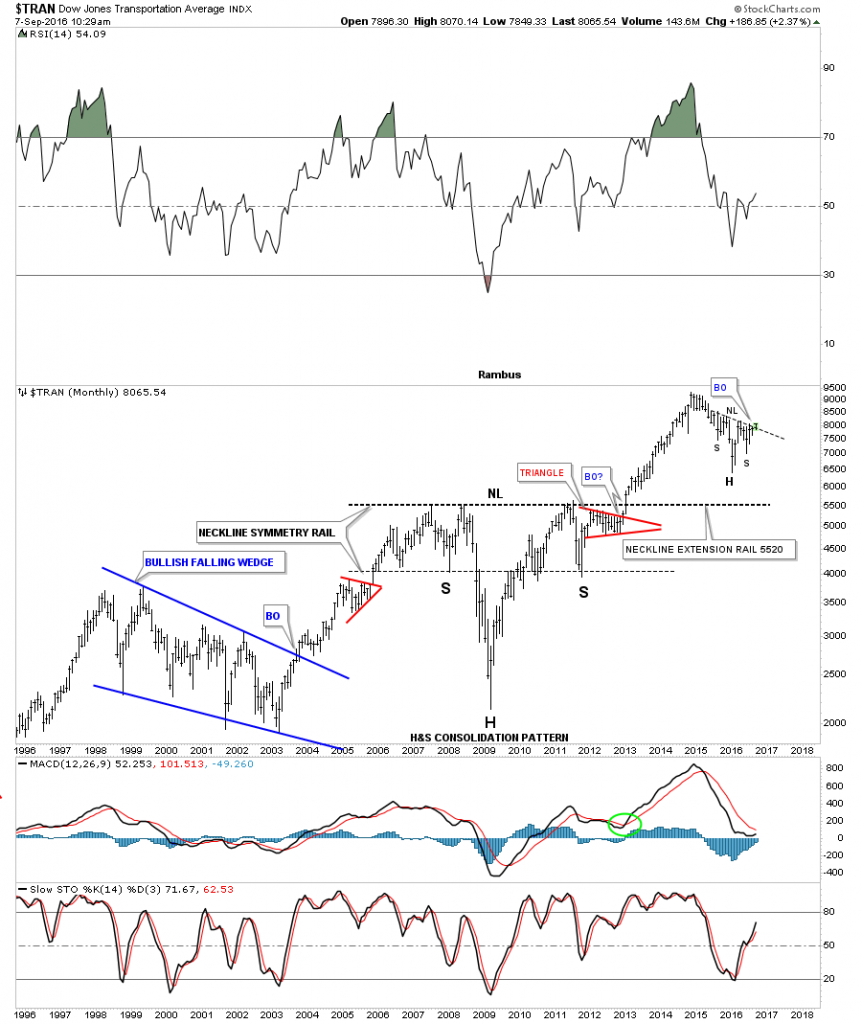
The monthly chart shows you how this beautiful H&S consolidation pattern fits into the big picture and why it’s a consolidation pattern and not a reversal pattern. Note its massive big brother that formed between 2006 and 2013 which was also very symmetrical as shown by the neckline symmetry line which shows us the low for the left and right shoulders.
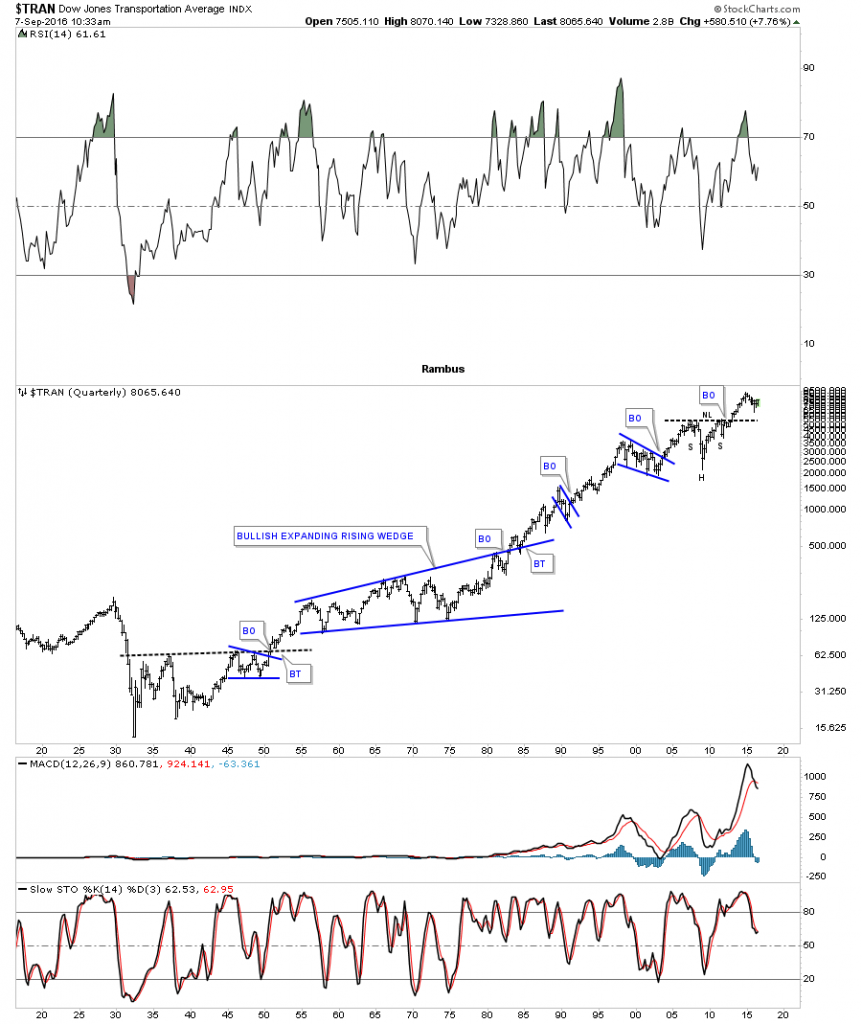
As you know for me perspective is everything. Below is a 100 year chart for the Transportation Average which shows how the big H&S consolidation pattern, on the monthly chart above, fits into the very big picture. What are these charts telling us going forward? Lets keep an open mind and follow the price action and let it tell us of its intentions and not the other way around.
Disclosure: None.


