
The Dow Jones Index Continues To Wallow
(Click on image to enlarge)
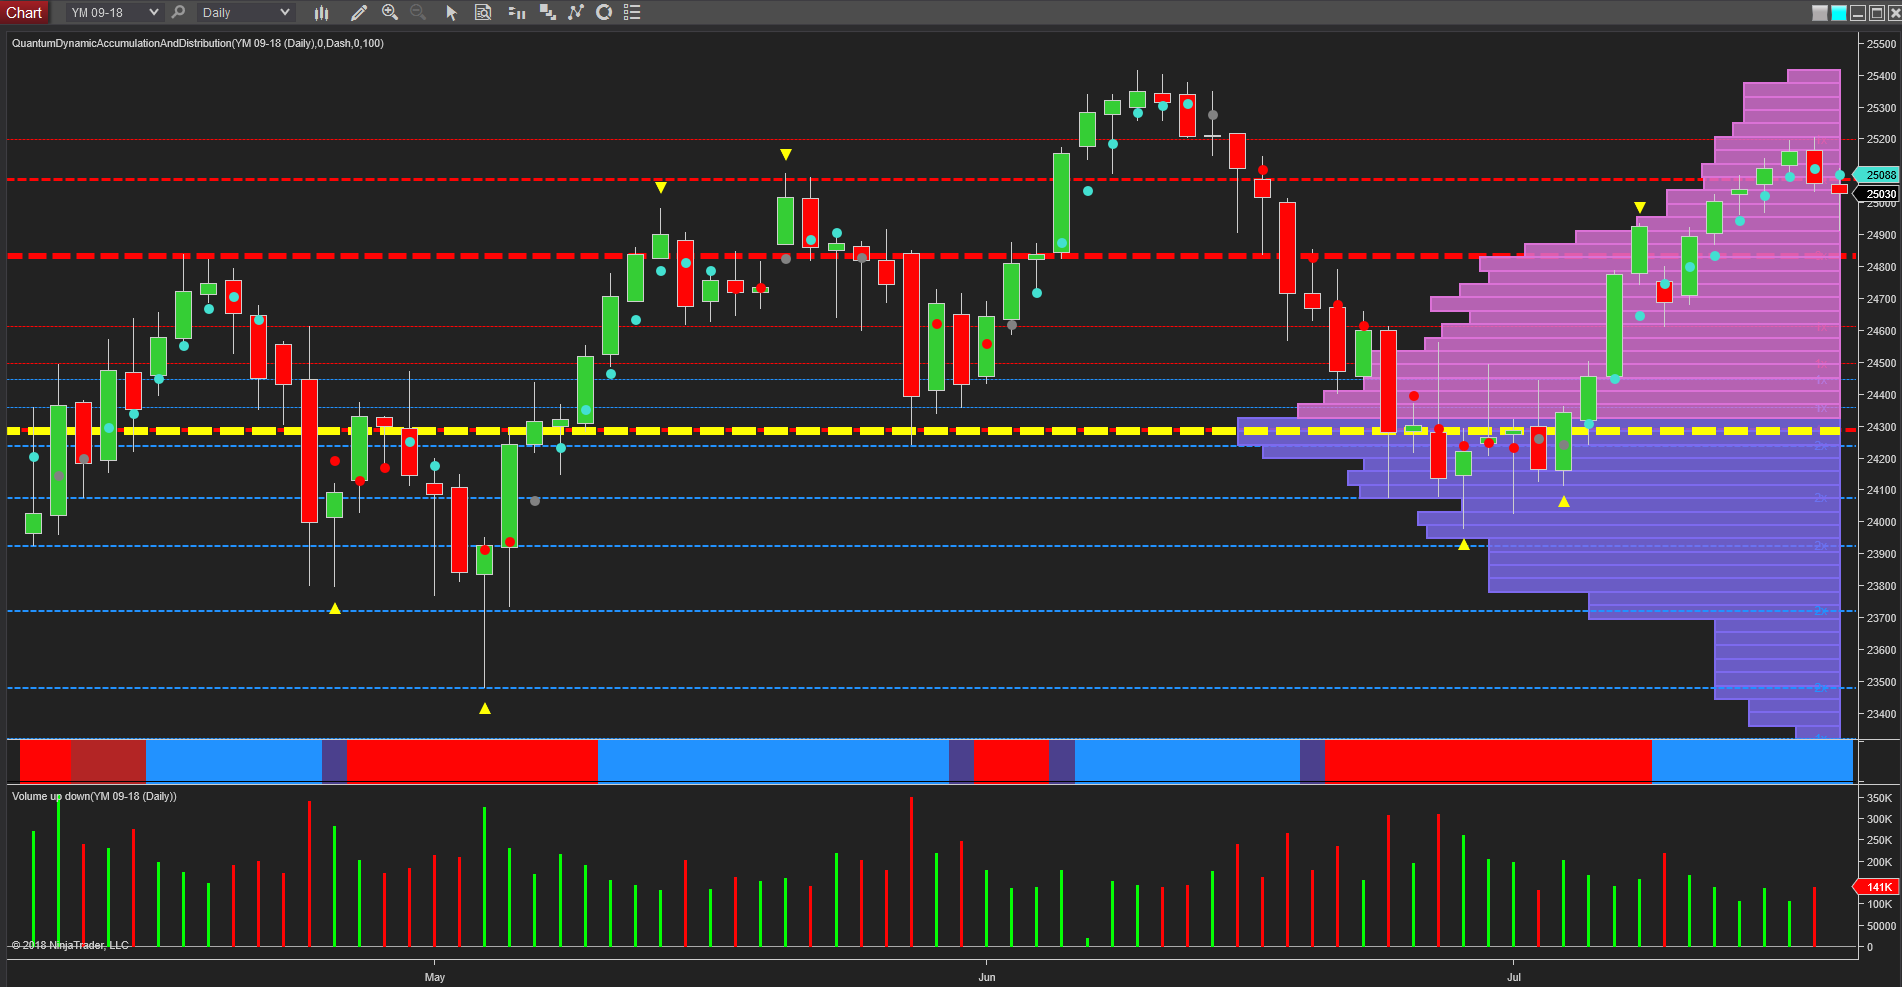
Whilst the Nasdaq and the S&P 500 continue to lead the way in US equity markets, it is the Dow Jones as reflected in the futures contract of the YM emini, that continues to bring up the rear of the current bullish trend higher. The NQ emini leads the way having already broken out into new high ground following the sharp reversal of earlier in the year, with the S&P 500 looking set to follow suit, whilst for the Dow Jones such a level remains a long way off at 26,719.
Last week was another for the index which promised much in the early part of the week, yet finished weakly as resistance in the 25,200 came into play and capping the bullish advance of the first three days. It is also interesting to note the volume associated with the rally for July, which has generally been declining as the index rose and moving firmly away from the volume point of control in the 24,300 region. As always at this time of year, we have to consider the seasonal aspects of volume since the decline in activity reflects the holiday period for traders. However, that said, a rising market on falling volume is not a strong signal for a continuation of the longer term trend, and indeed with further resistance now ahead in the 25,300 area, this too could add a further barrier to any continuation of the current trend. So for the daily chart, the index appears to be running out of steam and into an exhaustion phase.
(Click on image to enlarge)
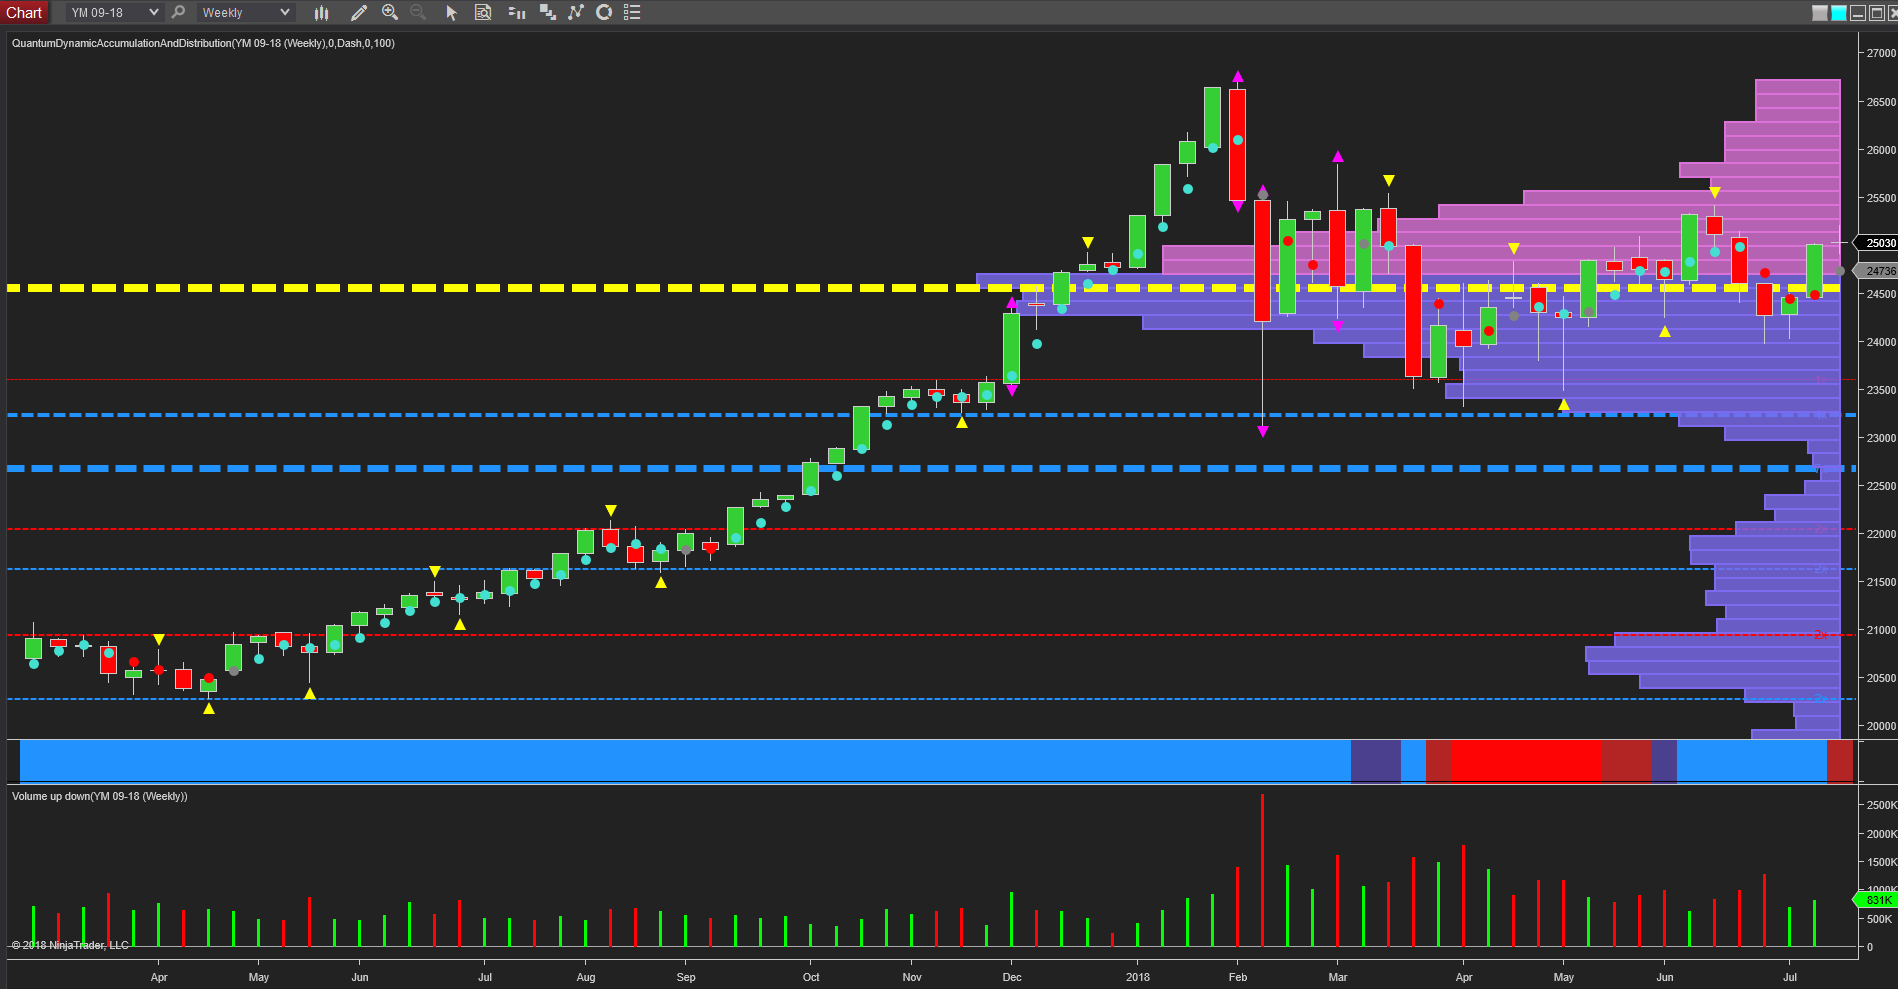
Moving to the weekly chart, this perhaps reflects more dramatically the current rather lackluster picture for the Dow, with the strong trend of 2017 in sharp contrast to the wallowing congestion for 2018. Indeed as we can see, the index continues to oscillate around the volume point of control in the 24,550 area with solid volumes overhead on the VPOC chart. Note also the rising volume under the move lower in June, and perhaps more worryingly the volume associated with the widespread up candle of two weeks ago which looks low. Finally with such strong resistance overhead in the 25,500 area, it is little wonder the index has struggled to break into new high ground and follow the Nasdaq, and until we see a dramatic increase in volumes, which may come once the holiday season is over, the YM looks set for further sideways price action on the slower timeframes with price action rotating around the volume point of control.
Disclaimer: Futures, stocks, and spot currency trading have large potential rewards, but also large potential risk. You must be aware of the risks and be willing to accept them in order to invest in ...
more

