
The Apple Pre-Earnings Trade: October, 2014 Edition
My favorite part of earnings season is typically the Apple (AAPL) earnings call. Apple’s earnings attracts out-sized amount of attention, and it is a time when I get to recalibrate my trading models.
My apologies to regular readers who were expecting a more timely update of the pre-earnings trading model for AAPL. I simply ran out of time before the bell. I did manage to do a quick review of the data and tweet this:
Given mixed sentiment & quick review, did puts expiring this Friday and call spread expiring next Friday. Will write up later. $AAPL
— Dr. Duru (@DrDuru) October 20, 2014
The rest of this post is a quick review of what I saw.
As a reminder, the main point of the pre-earnings trade is to determine whether Apple’s price and stock action going into earnings can suggest anything about the behavior of the stock in the day immediately following earnings. These relationships are only potentially interesting because Apple can produce some stellar one-day, post-earnings results with a very strong upside bias.
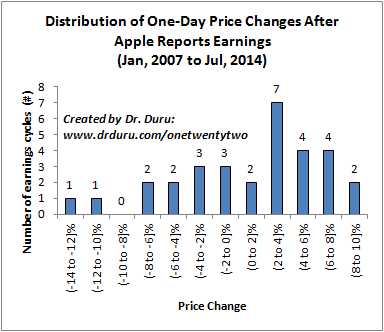
Distribution of One-Day Price Changes After Apple Reports Earnings
(Jan, 2007 to Jul, 2014)
The most common of the price ranges is between 2 and 4% (exclusive of 2%, inclusive of 4%). Overall, since 2007, AAPL has a strong bias to trade UP in the day after earnings: 19 out of 32 tries or 61%.
That alone is powerful enough information: traders could just bet on upside every earnings and get a nifty 3 out of 5 win rate. The model could be even more powerful if it could identify the times that are best to bet on upside and the times to bet on downside. In fact, there ARE situations where AAPL has displayed distinct patterns.
April and July are the best months for making post-earnings bets.
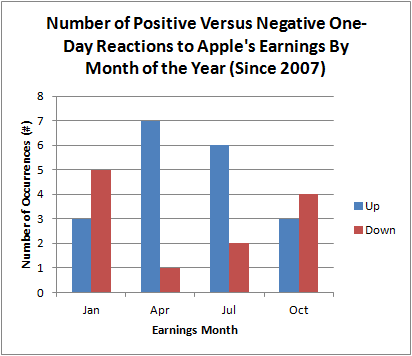
Number of Positive Versus Negative One-Day Reactions to Apple’s Earnings By Month of the Year (Since 2007)
I also look to see whether the price changes in AAPL’s stock going into earnings indicate any additional information.
Since 2012, a distinct shift happened in AAPL where the market tends to sell AAPL on average in the 7 and 14 days leading up to earnings. I have yet to use this information to FADE AAPL rallies ahead of earnings, but it could be about time that I try (in combination and confirmation with the Apple Trading Model of course).
Click image to see larger view…
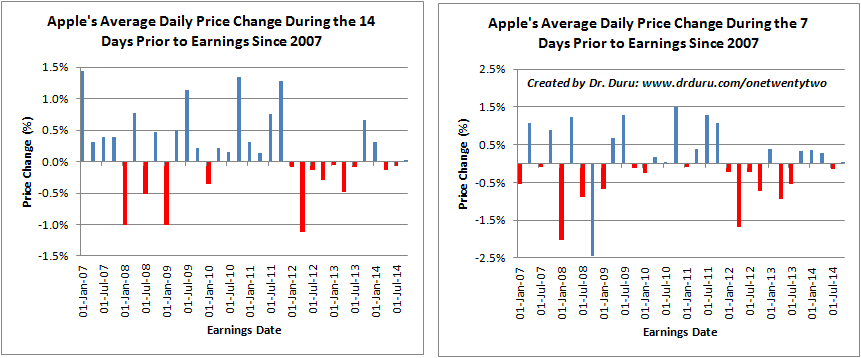
Apple’s Average Daily Price Change During the 7 and 14 Days Prior to Earnings Since 2007
This time around, AAPL was pretty much stuck in a trading range except for a brief breakdown period. The average 7 and 14-day price changes for the October, 2014 earnings were BOTH 0%! AAPL even managed to exactly test 50DMA ressitance/support going into earnings almost in the middle of the current consolidation area.
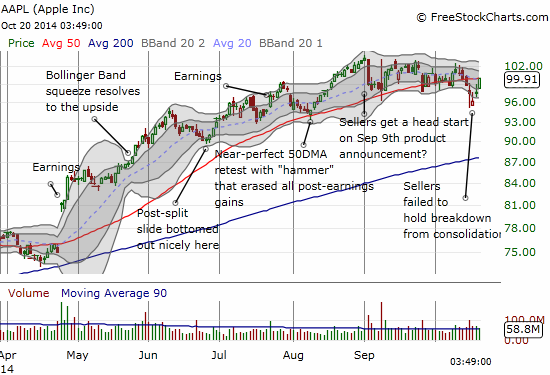
A locked battle between buyers and sellers ends right at the 50DMA…AND the $100 mark…ahead of October, 2014 earnings
Source: FreeStockCharts.com
Because of the flat performance going into earnings, I could not use the tendency toward inverse correlation between the average price change going into earnings and the price performance on the day following earnings.
Click image to see larger view...
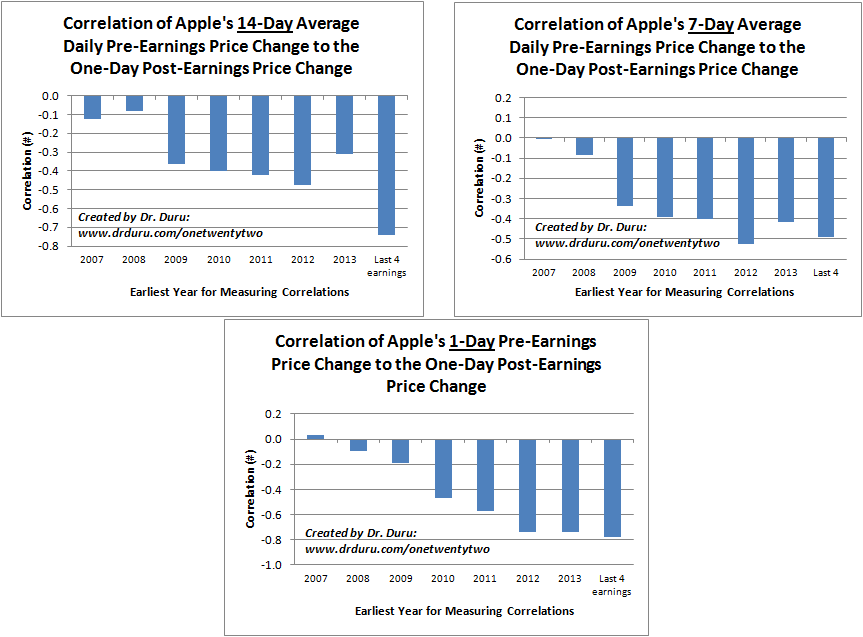
Correlation of Apple’s 14, 7, and 1-Day Average Daily Pre-Earnings Price Change to the One-Day Post-Earnings Price Change
AAPL closed the day with a very strong 2.1% gain the day ahead of earnings. So, according to the last chart showing the correlation of the pre-earnings and the post-earnings days of price changes, AAPL should sell-off after this October’s earnings. The first two charts are not usable for the October earnings.
On a quarterly basis, it turns out that only April earnings delivers a very strong correlation of pre and post-earnings price changes. The other months under different scenarios are quite mixed.
Click image to see larger view…
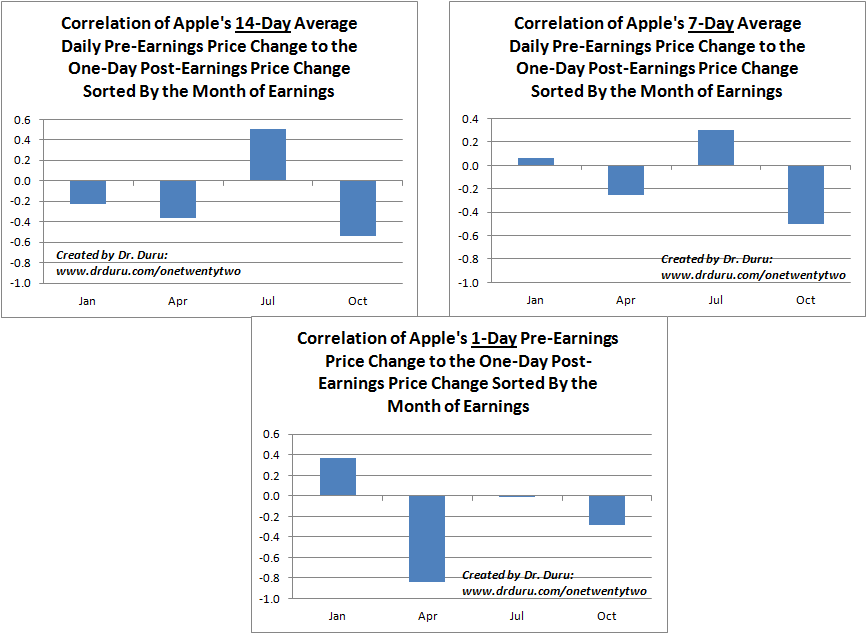
Quarterly Correlation of Apple’s 14, 7, and 1-Day Average Daily Pre-Earnings Price Change to the One-Day Post-Earnings Price Change
So, net-net, the price relationships left me with a very mixed picture. So I turned to some sentiment indicators to try to break the tie. Unfortunately, sentiment is quite mixed as well. However, the soaring put/call open interest ratio may be the most important indicator below. All snapshots are from Schaeffer’s Investment Research.
First, analysts are very bullish: 22 strong buys, 5 buys, 6 holds, and no sells or strong sells.
Next, shorts are almost non-existent and at lows unmatched in at least two years.
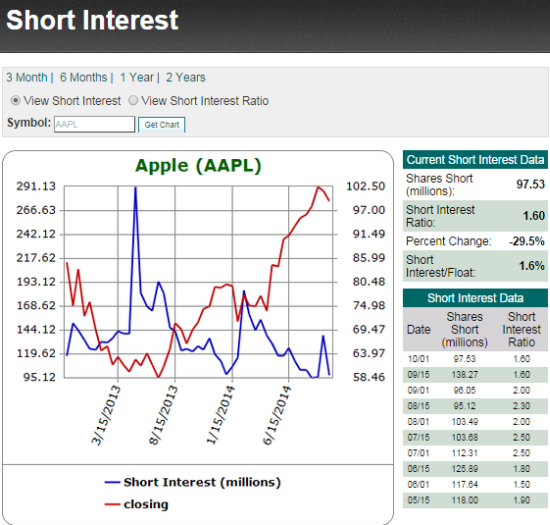
Shorts are almost non-existent in Apple with shares short even at a 2+ year low
Finally, traders have sent the put/call ratio nearly straight up.
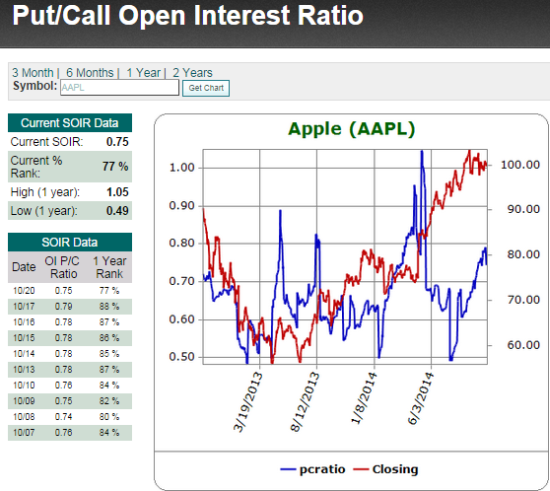
Bears have ramped up bets against AAPL over the past 3 months as AAPL’s stock went almost nowhere
Although the sentiment signals are mixed, the ramp in the put/call open interest ratio really caught my attention. It tells me that a lot of people are betting against Apple and/or sitting on well-protected positions. I think more of the latter since Apple’s stock has been stuck in a trading range. So, IF Apple can maintain bullish momentum post-earnings, I am inclined to think the rally will be sustained.
This analysis led me to the mixed position indicated in the tweet above. I grabbed a fistful of weekly $97 puts for the case of AAPL severely disappointing. Given the market isfresh out of an oversold period, I expected Apple to lose at least 5% in the case of a big disappointment as sellers rushed back in. For example, see what happened to IBM!
I balanced the bearish bet call spreads expiring the following Friday. As I noted above, if AAPL gets a post-earnings thumbs up, I expect the stock to go on a sustained run-up. It is very likely that the quick breakdown of the consolidation period took out stops and washed out the weakest hands in AAPL. With positive news, those sellers will rush back in as buyers and/or the strong hands will be quite content to keep riding the stock higher. I bought a call spread mainly because I did not want to pay pre-earnings premium on both sides of the trade. Moreover, my suspicion of the strong pre-earnings move led me to expect that odds were slightly in favor of downside.
I hate making such a wishy-washy play, but it seemed best given the risk/reward outlook. It is harder to make good profits given the upside is capped by the spread, and I pay more in commissions. Anyway, time to see what happens. At the time of writing, AAPL produced a positive result but the stock was only up about 1% in after-market trading.
Be careful out there!
Full disclosure:long AAPL puts and AAPL call spread


