
The 46-Year Record Of Platinum-Gold Ratios
The gold to silver and platinum to gold price ratios determine the relative value of the precious metals and are useful parameters in deciding which metal to buy at any given time.
In a previous musing, I documented the history of gold and silver prices and gold-silver ratios from the United States’ abandonment of the gold standard in August 1971 to present.
In today’s precious metals analysis, I focus on the distribution of platinum-gold ratios over the past 46 years.
The monthly average price charts for each metal from January 1971 to present are shown below:
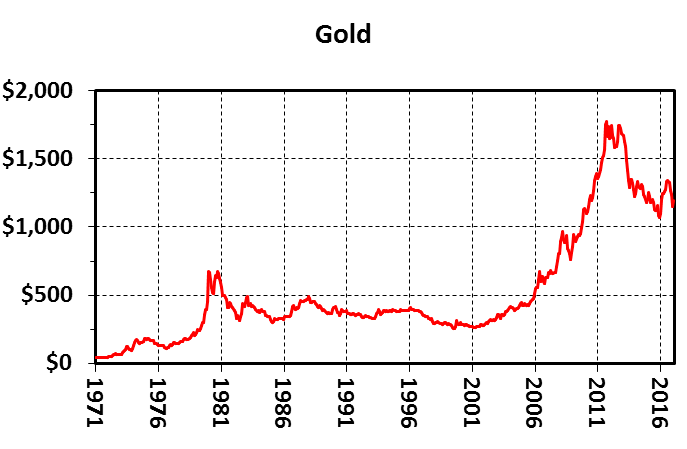
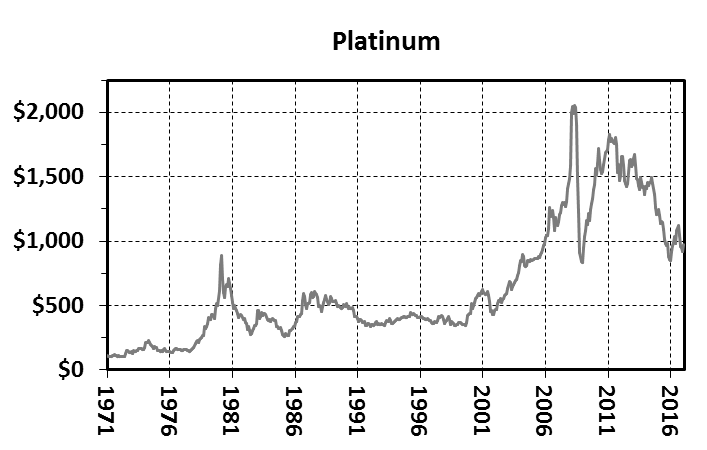
The price charts show similar patterns and a general correlation of gold and platinum prices. However, platinum is more volatile than gold and subject to parabolic spikes.
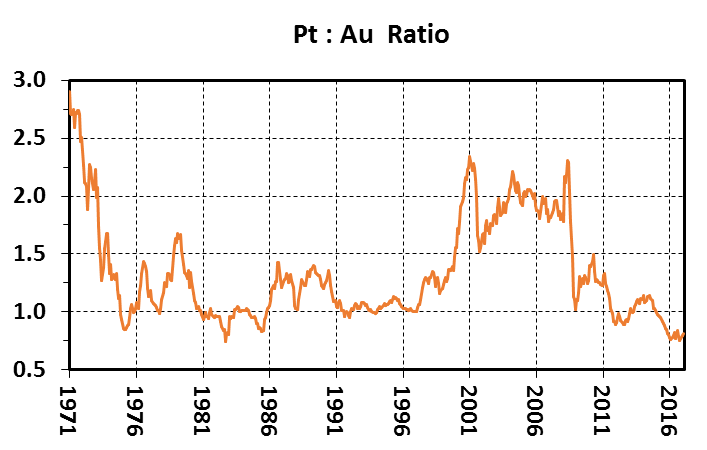
Platinum to gold ratios show wide variance over the 46 year period ranging from highs above 2.5 before and soon after Nixon began taking the United States off the gold standard to periodic lows below 1.0:
Our data set covers 553 months beginning in January 1971. The distribution of ratios in both tabular and chart format follows:
Distribution of Pt:Au Ratios
|
Ratio |
% of Months |
|
<0.85 |
4.7 |
|
.85-1.0 |
15.0 |
|
1.0-1.25 |
34.7 |
|
1.25-1.5 |
19.3 |
|
1.5-2.0 |
15.4 |
|
2.0-2.5 |
8.9 |
|
>2.5 |
2.0 |
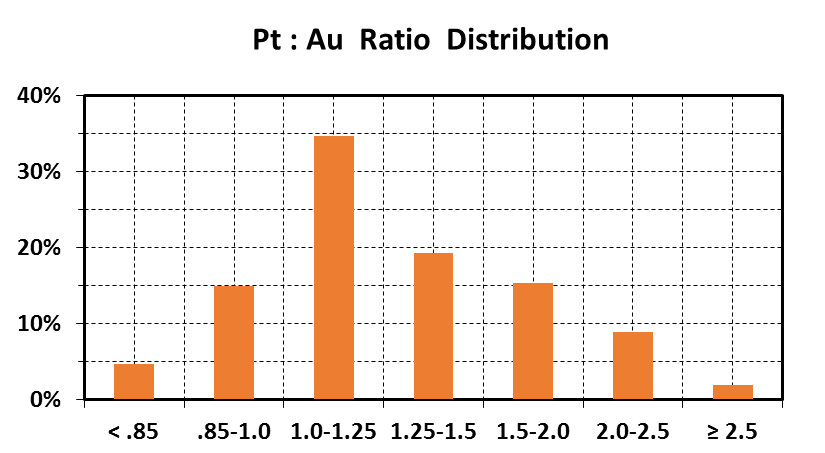
From our data set and the distributions of monthly average platinum-gold ratios from January 1971 thru January 2017, I glean the following:
- A ratio of less than 0.75 is a single outlier that occurred once during the second half of 1982 when overall ratios averaged 0.81.
- Ratios <0.85 are quite unusual at 4.7%. They occurred for two months in the first quarter of 1975, the aforementioned six months in 1982, in June-July of 1985, and for an ongoing run of 16 months that commenced in October 2015.
- Ratios from 0.85 to 1.0 constitute 15.0% of the record.
- Pt:Au from 1.0 to 1.25 is the most common range and comprises 34.7% of ratios since 1971.
- The ratios between 1.25 and 1.5 occur 19.3% of the time.
- Ratios from 1.5 to 2.0 make up 15.4% of the record.
- The 2.0-2.5 interval covers 8.9% of the months in our compendium.
- The 11 monthly outliers at >2.5 comprise 2.0% of the total record and have not occurred since 1971.
From a compendium of sources, the average crustal abundance of both metals is around 4 ppb. Based solely on this fact, platinum and gold should trade at about the same price.
And indeed, our compilation shows that for nearly 50% of the time since gold was decoupled from the world’s reserve currency and allowed to trade freely on exchanges, the price ratio has ranged from 0.85 to 1.25. That said, since January 1971, the average price of platinum has been $637/oz and gold has been $518/oz for an overall ratio of 1.23:1. Clearly there are other factors other than the nearly equal crustal abundances that account for this historic price relationship.
A variety of supply and demand factors cause platinum to trade at a premium to gold:
- Platinum is a much smaller market. Cumulative world production of platinum is estimated to be about 5% of gold (9400 tonnes versus 182,000 tonnes). From 1994-2014, 3700 tonnes of platinum were mined versus 52,600 tonnes of gold or about 7% (source: USGS).
- Platinum is largely an industrial metal. Catalytic converters, electronics, petroleum and chemical catalysts, medical technologies, and many minor uses constitute over 60% of its annual demand. Around 30% is used in jewelry and 10% for investment demand. Also, 30% of the annual platinum supply now comes from recycling, mostly from catalytic converters. Some demand is consumed and lost to the marketplace.
- Gold is overwhelmingly a precious metal; 90% is used in jewelry and investments and only 10% in industrial applications. An estimated 98% of all the gold ever mined in the world remains available and held in jewelry, by central banks, in private hoards, and as fabricated products (source: USGS).
- About 70% of yearly platinum mine supply comes from South Africa, a geopolitically risky country. Much new platinum is a by-product of nickel-copper mining and smelting; therefore, annual platinum production is dependent on the supply-demand fundamentals and prices of these primary metals.
Fluctuations in the relative prices of platinum and gold are largely driven by:
- the overall growth and health of the world’s economy and in the case of platinum, the automotive industry;
- labor, power, currency, and political issues in South Africa that cause major perturbations in the platinum supply;
- safe haven hoarding of gold and to a much lesser extent, platinum, in times of economic uncertainty and major geopolitical events;
- speculators moving in and out of paper markets of both metals (bullion exchanges, ETFs, and derivatives) and to a lesser extent, central bank trading of physical gold.
In my opinion, gold is the only real money. Thus it is my safe haven of choice and insurance policy against financial calamity.
Platinum functions both as a precious and industrial metal. It is usually tied to the price of gold in both short- and long-term trading patterns. In times of financial distress and economic turmoil, platinum tends to behave more like gold with widespread hoarding.
The platinum-gold ratio can be used to ascertain whether one metal is over- or undervalued with respect to the other. The current monthly average ratio below 0.85 is unusual and indicates that platinum is severely undervalued with respect to gold.
When ratios are very low, I choose to buy platinum instead of gold. Note that the mark-up to buy or sell platinum is two to three times higher than for gold; that additional cost becomes a factor in my evaluation process.
I strive to maintain 10-20% of my net worth in physical bullion. Most is in gold but I always have a portion in platinum and silver.
As a hoarder, my basic strategy for accumulating gold or other precious metals is to buy during downticks in price regardless of a bull or bear market cycle. In a previous musing, I showed that there is seasonality to the gold price and that the best time to buy is from mid-June to mid-August of any given year. The same strategy can be applied to platinum.
Once again folks, that is the way I see it.
And the way I do it.


Thanks for sharing
Good job here Mickey. The interplay of the various precious metals tells so much about valuation, the economy, the market's mood, etc.