
The 4-Mistakes In Your Financial Plan

So, you’ve decided to undertake comprehensive financial planning.
A properly designed financial plan will cover important elements like retirement savings, insurance analysis and estate review; a qualified planner will target and outline specific areas of strength and weakness along with flexible, realistic routes to each financial goal.
If you’re stressing over the process, how long it takes to get a plan together: Don’t. Yes, there’s a financial self-discovery period on your part and that will take effort and homework. However, a plan can be modular based on your most important concern first, then built on over time.
Let me be one of the first to say congratulations on your decision!
You must be serious about financial awareness. After all, there are none of the day-to-day highs and lows of the stock market.
No sizzle. So boring.
Financial planning doesn’t make headlines or capture the attention of media talking heads.
It flies under the radar.
And to that I say:
Thank goodness.
Consider financial planning the mundane sentinel which forms the foundation of money awareness. When plans are attached to goals or life benchmarks as I call them, they take on a life of their own as progress markers along the path to a successful financial life.
A plan is a complete diagnostic of money chemistry. And the numbers don’t lie.
At times, it’s is validation, other times, an awakening.
On occasion, a warning.
See? Perhaps planning is exciting (we’ll keep that between us. Our own little secret).
Now that I have your attention and you’re ready to go, I’ll share 6 hidden dangers for investors to heed.
Mistake #1: You depend on the wrong tools to get the job done.
Online publicly-available financial planning calculators are the junk food of finance posing as nutritious choices. I guess it’s better than nothing, however just because a planning calculator is available from a reputable firm like Vanguard or Charles Schwab surprisingly doesn’t make it worthy of consideration.
As a matter of fact, per a study, the efficacy of publicly-available retirement planning tools from 36 popular financial websites was challenged and results were extremely misleading.
These quick (worthless) financial empty-calories don’t provide enough input variables to provide a level of accuracy. Most egregious is the dramatic over-estimation of returns and plan success.
If you trust an online calculator to adequately plan for retirement or any other long-term financial life benchmark and feel confident in the output (most likely because it provided a positive outcome,) then you’re ostensibly setting yourself for dangerous surprises.
Avoid them. They’re not worth it. Best not to do any planning at all if it’s this route.
Mistake #2 – The plan is used to sell product.
Antoinette Koerner, a professor of entrepreneurial finance and chair of the finance department at the MIT Sloan School of Management, along with two co-authors, set out to analyze the quality of financial advice provided to clients in the greater Boston area.
They employed “mystery shoppers” to impersonate customers looking for advice on how to invest their retirement savings. Unfortunately, it didn’t work out too well.
Advisors interviewed tended to sell expensive and high-fee products and favored actively-managed funds over inexpensive index fund alternatives. Less than 8% of the advisors encouraged an index fund approach.
The researchers found it disconcerting how advisor incentives were designed to motivate clients away from existing investment strategies regardless of their merit. They found that a majority of the professionals interviewed were willing to place clients in worse positions to secure personal, financial gain.
So, let me ask:
“Would you rather have a comprehensive plan completed by a professional who adheres to a fiduciary standard where your financial health and plan are paramount, or a broker tied to an incentive to sell product?”
Brokerage firms are willing to offer financial plans at no cost. However, the price ultimately paid for products and lack of objectivity, is not worth a ‘free’ plan. It’s in a consumer’s best interest to find a financial partner who works on an hourly-fee basis or is paid to do the work, not based on investments sold.
Last month, I met with a gentleman whose comprehensive financial plan inspired most of this blog post. The financial plan completed by his advisor was fraught with conflicts of interest and mistakes I’ll expand upon. The plan was not designed for an individual who was about to “cross over,” as I define it.
In other words, the plan was not designed for an individual preparing to retire within 5 years and look to begin a lifetime income distribution strategy. Nothing about longevity assessment (which we do through analysis to help people plan realistically based on health habits and family history), zero about proper Social Security strategy including spousal retirement and survivor benefits maximization, nada about how or if he should take his pension, along with erroneous inflation rates.
What stood out was the recommendation of a sizable investment in a variable annuity.
I couldn’t understand why an annuity was recommended, especially a variable choice with an income rider that was not required. Based on my analysis, this successful earner, saver, and investor had enough to meet joint fixed expenses for life-based on pension and Social Security optimization alone.
Annuities are usually sold, not planned.
However, in this case, a plan was purposely engineered to roll a lump-sum investment into a product that wasn’t needed. No other option for the pension was provided but to roll it over into an annuity without further investigation.
It felt like the plan was patchworked to conclude in a product sale. A variable annuity may have been suitable, but it certainly wasn’t in the highest and best or fiduciary interest of the prospective investor. Be careful out there. Get a second opinion from a registered investment adviser who offers a fiduciary level of care.
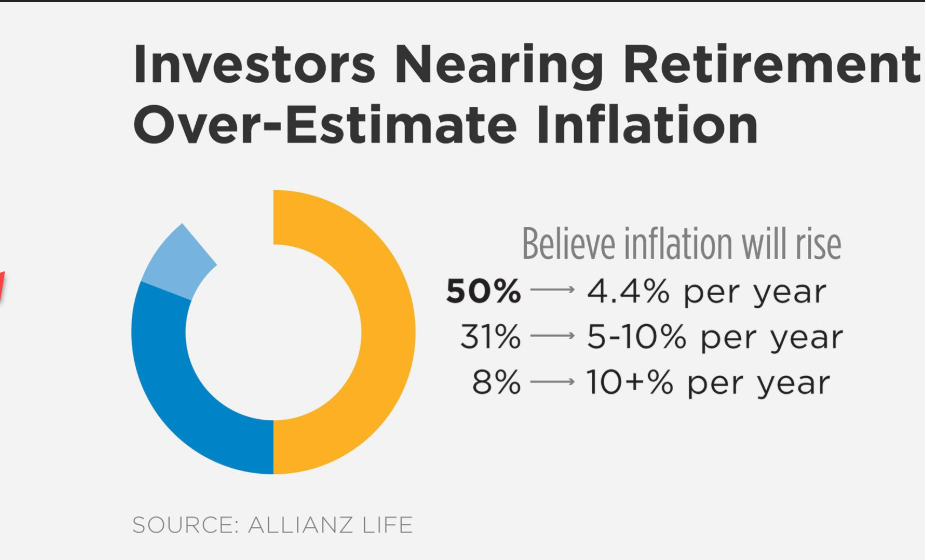
Mistake #3 – Beware of the inflation-scare method
At Clarity we provide countless second opinions on financial plans; a trend that consistently emerges is the omnipotent annual 3% inflation rate. Regardless of the expense goal, even medical (which should be higher), the 3% blanket annual inflation rate, in my opinion, is left in as the default selection that never gets updated perhaps as a method to scare investors into managed product and possibly overweight stocks. Candidly, many financial professionals do not understand inflation.
When having a financial plan completed, consumers must be smarter about inflation rates and make sure their planners are knowledgeable when it comes tying applicable rates of inflation to each goal.
Keep in mind – inflation is personal to and differs for every household.
My household’s inflation rate differs from yours.
Thanks to an inflation project undertaken by the Federal Reserve Bank of Atlanta, there’s now a method to calculate a personal inflation rate. A smart idea is to compare the results of their analysis to the inflation factor your financial professional employs in retirement and financial planning. Instruct your adviser to complete an additional planning scenario which incorporates your personalized consumer price index and see how it affects your end results or outcomes.
The bank has undertaken a massive project to break down and study the elements of inflation along with the creation of a myCPI tool which captures the uniqueness of goods that individuals purchase.
Researchers estimate average expenditures using a calculation which incorporates various cross-demographic information including sex, age, income, education and housing status. The result is 144 different market baskets that may reflect a closer approximation to household’s personal cost of living vs. the average consumer. It’s easy to use and sign up for updates. Try it!
My personal CPI peaked in July 2008 at an annualized rate of 5.2%. Currently, it’s closer to 1.2%. For retirement planning income purposes, I use the average over the last decade which comes in at 2.3%.
The tool can help users become less emotional and gain rational perspective about inflation. Inflation tends to be a touchy subject as prices for everything must always go higher (which isn’t the case). I’ve witnessed how as a collective, we experience brain drain when we rationalize how inflation impacts our financial well-being. It’s a challenge to think in real (adjusted for inflation) vs. nominal terms.
I hear investors lament about the “good old days,” often where rates on certificates of deposit paid handsomely. For example, in 1989, the year I started in financial services, a one-year CD yield averaged 7.95%. Inflation at the time was 5.39%. After taxes, investors barely earned anything, but boy, those good old days were really somethin’ weren’t they?
We’re so-called inflation experts because it co-exists with us. It’s an insidious financial shadow. It follows us everywhere. We just lose perspective at times as the shadow ebbs and flows, shrinks and expands depending on our spending behavior. Interestingly, as humans, we tend to anchor to times when inflation hit us the hardest.
Worried about inflation in retirement? Let’s whittle down this myth of massive inflation in retirement. Decreased spending in retirement offsets price increases based on conclusions of multiple studies. For example, according to David Blanchett, CFA, CFP® Head of Retirement Research at Morningstar in his Working Paper titled “Estimating the True Cost of Retirement,” the following holds true:
“While a replacement rate between 70% and 80% may be a reasonable starting place for many households, when we modeled actual spending patterns over a couple’s life expectancy, rather than a fixed 30-year period, the data shows that many retirees may need approximately 20% less in savings than the common assumptions would indicate.
Real retiree expenditures don’t rise (or fall) in nominal terms simply as a function of broad-based inflation or expected health care inflation. The retirement consumption path, or “spending curve,” will be a function of the household-specific consumption basket as well as total consumption and funding levels.
When correctly modeled, the true cost of retirement is highly personalized based on each household’s unique facts and circumstances.”
A generic inflation rate used by most planners overstates the inflation risk most retirees will experience.
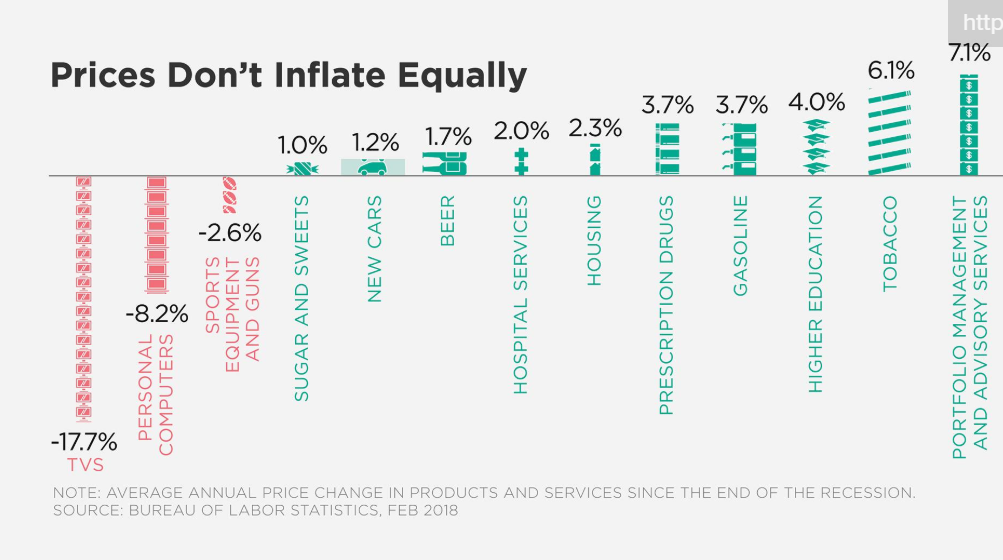
While at Clarity we use a 1.7% inflation rate in planning for most needs (except certain categories of healthcare, higher education and long-term care costs which we increase at 4.5% annually), a personalized rate for those who go through the myCPI is highly recommended.
According to an insightful myth-busting analysis by John Kador for www.wealthmanagement.com, prices don’t inflate equally. Now if more financial professionals would get the picture and use the information for accurate planning purposes (let’s not hold our breaths).
Mistake #4 – Market return projections only for vampires
I am 100% confident that stocks always move higher in the long run.
I know for certain the Dow will reach 60,000. I probably won’t be alive to witness it, but I know it’s going to happen. I do. Markets are infinite. Unfortunately, humans are finite. Unless you’re a vampire, there are going to be times when you’ll battle through return headwinds or glide easy thanks to tailwinds. There will be extended periods (hopefully not yours) when dollar-cost averaging will seem like treading wealth through thick sludge. Other times, it’ll feel like your money is lithe and positive returns occur with minimal or zero effort.
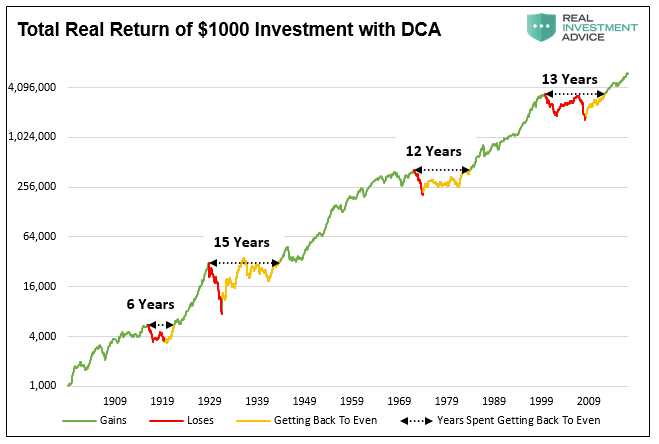
As Lance Roberts states:
“The most obvious is that investors do NOT have 118 years to invest. Given that most investors do not start seriously saving for retirement until the age of 35, or older, most investors have just one market cycle to reach their goals. If that cycle happens to include a 10-15 year period in which total returns are flat, the odds of achieving their savings goals are massively diminished. If an investor’s 30-year investment cycle happens to end with a major market crash, the result was devastating. Time, duration and ending dates are crucially important to expected investor outcomes.”
What if you’re in retirement and distribution mode? Market headwinds can be devastating.
James B. Sandidge, JD in his study “Adaptive Distribution Theory,” for the Investments Wealth Institute, provides several eye-opening examples of drawdown risk. As we monitor portfolio distributions over rolling three-year periods, Clarity is prepared to have retirees make changes to withdrawal rates or dollars as they cannot count on time to breakeven from combined market and portfolio distribution erosion. What does matter is the timing of returns, especially losses.
Whether you retire in a market head or tailwind is good or bad luck.
If recently retired, we believe at RIA that you’re going to expect overall market headwinds over the next 10 years (sorry) and must prepare to reduce portfolio distributions.
I’m sorry. Again, it’s just a drawing of the straws. Nothing personal.
James includes several effective charts and tables in his work. Table 4 hits home for me.

An investor in a 60/40 portfolio who retired at the end of February 2008 suffered a 26.8% loss in the first 12 months of retirement. A 5% withdrawal was recommended for living expenses through that period. This hits home for me personally because I witnessed financial professionals suggesting 4-5% withdrawals that year and recite the “stocks always move higher in the long run,” mantra. It was almost like these pros wouldn’t believe what was happening and couldn’t help retirees adjust their spending expectations. The triple deadly combo of market loss, unrealistic withdrawal rate, and investment management fees lead to a first-year devastating principal erosion of 32.8%!
In 2010, the new retiree is probably anxious to return to the workforce. Subsequently, with a smaller asset base of $672,000, a 5% withdrawal is no longer $50,000. It’s $33,600. What a horrific life-changing experience. I never want to be the adviser on the other side of the desk delivering this bad news.
James outlines – “
Thus the “risk three-step” – a rapid reduction of principal, followed by a reduction in cash flow, followed by investor panic. Many retires can tolerate gradual principal erosion, but many fewer would find a 33-percent drop in principal and cash flow acceptable after one year of retirement.”
Lance Roberts and I had to adjust down our return estimates for every asset class in our planning software; international and emerging markets have the greatest opportunities for long-term asset class returns, however, they’re adjusted lower, too. If we model higher returns, the risk to get those returns increases thus putting clients in danger of not reaching their financial goals unless they increase their savings rates, reduce debts/expenses or work longer than anticipated.
Most likely, your plan investment return estimates are too optimistic. Again – Designed more for bloodsuckers. Not people.
To a broker, flat or bear market cycles don’t exist. Realistically, the dogma is false narrative. If you fall for it, you may wind up spending an investment life making up for losses or breaking even.
Most financial planning software generates outcomes based on something called “Monte Carlo” simulation. It’s as close as planners get to represent the variability of market returns over time.
Monte Carlo generates randomness to a portfolio and simulates, perhaps thousands of times, around an average rate of return. Unfortunately, asset-class returns most Monte Carlo tools incorporate tend to be optimistic.
In addition, even though Monte Carlo simulates volatility of returns, it does a very poor job representing sequence of returns which I think of as a tethered rope of successive poor or rich returns.
Per friend and mentor Jim Otar, a financial planner, speaker and writer in Canada:
“Markets are random in the short term, cyclical in the medium term, and trending in the long term. They are neither random, nor average, nor trending in all time frames. Secular trends can last as long as 20 years (up down or sideways). The randomness of the markets are piggybacked onto these secular trends. Assuming an average growth and adding randomness to it does not provide a good model for the market behavior over the long term and it makes the model to “forget” the black swan events.”
It’s why at Clarity, as a backstop, we employ various planning methodologies which incorporate how market cycles operate and where your goals may fall within them.
Granted, a comprehensive plan experience won’t be the talk of your next cocktail party. However, it just may allow you the freedom and peace of mind to enjoy the benchmarks you work hard every day to reach.
Last, the only person who will succumb to the hidden dangers in financial plans is you. However, you’re now aware of the financial minefields that are a ‘must avoid.’


