
Thanksgiving Market Returns
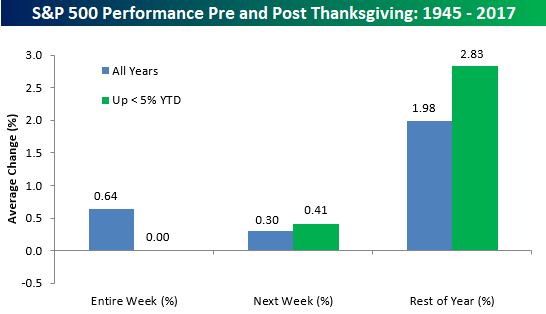
Thanksgiving week is typically considered a positive time for the equity market, and since WWII, the S&P 500 has averaged a gain of 0.64% with gains three-quarters of the time. Market trends heading into this Thanksgiving aren’t as positive for the bulls, though. As shown in the table below, during years where the S&P 500 was positive but up less than 5% heading into Thanksgiving week, the index’s average change during the week was 0.00% with gains less than half of the time.

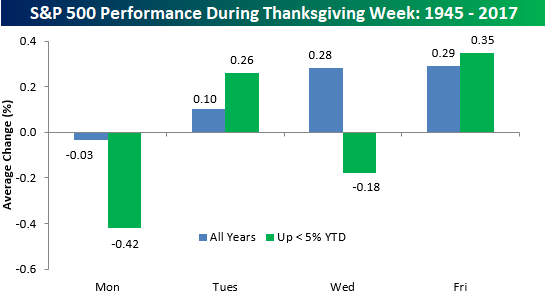
On a day to day basis, for both all years since WWII and in years where the S&P 500 was up less than 5% heading into Thanksgiving week, Monday has been the worst trading day as it is the only day of the week with negative average returns and positive returns less than half of the time. Tuesdays and Friday, however, have been positive days, though, with average gains of 0.10% and 0.29%, respectively. Additionally, for those years where the S&P 500 was up YTD but less than 5%, Tuesdays and Fridays have been even stronger with average gains of 0.26% and 0.35%, respectively.
As we move past Thanksgiving, though, seasonal trends for the market based on this year’s performance so far, improve. In those years where the S&P 500 was up less than 5% YTD heading into Thanksgiving week, the average gains the week after Thanksgiving was 0.41% with positive returns 55% of the time. For the remainder of the year, average returns were even stronger at 2.83%. Not bad for a little more than five weeks!
Disclaimer: To begin receiving both our technical and fundamental analysis of the natural gas market on a daily basis, and view our various models breaking down weather by natural gas demand ...
more

