
Testing Smart Beta With Two Relatively Long Real-Time Records
Factor funds (aka smart beta funds) have been proliferating like rabbits in recent years, accompanied by marketing hype that can put political campaigns to shame. In some cases the strategies have merit, but playing fast and loose with the facts isn’t uncommon. In the worst cases, products look like thinly veiled excuses to charge relatively high fees with little or no advantages over a plain-vanilla index fund that targets a similar set of securities. How can you tell the difference? A deep dive with analysis is the only solution.
Fund companies, of course, would like you to focus on the backtest, which are always impressive. But beware: the failed backtests never see the light of day and so the old problem of selection bias is lurking. When’s the last time you read a discouraging backtest report?
One real-world track record is worth a thousand backtests. Alas, most of the factor funds in existence are relatively new. Two exceptions in the ETF space: Guggenheim S&P 500 Equal Weight (RSP) and PowerShares FTSE RAFI US 1000 Portfolio (PRF). With track records in excess of 10 years, the two funds offer some of the longer tests of factor investing with actual money in terms of publicly traded products. The obvious question: How has this pair performed relative to their market-cap benchmarks?
Let’s take each fund separately, starting with Guggenheim S&P 500 Equal Weight (RSP). As its name suggests, the strategy is equal weighting all the S&P names and periodically rebalancing back to equal weights. The list of stocks matches the standard S&P 500 Index, but whereas the conventional S&P lets Mr. Market weight the names based on market cap, RSP keeps the weights evenly balanced.
Although some folks don’t think of equal weighting as a factor strategy, this systematic and dead simple application is a close cousin and so it’s reasonable to consider when shopping in the smart beta market. In any case, the results looks encouraging. Although RSP’s trailing five-year return is only fractionally above the SPDR S&P 500 (SPY), an ETF that tracks the market-cap version of the index, the equal-weighted fund’s annualized 10-year record is considerably stronger courtesy of a 100-basis-point return premium over SPY.
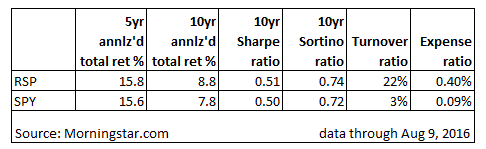
Meantime, RSP’s risk levels are comparable with SPY, based on the Sharp ratio and Sortino ratio. Portfolio turnover is higher and so is the expense ratio. Nonetheless, RSP has delivered a moderately higher 10-year return with comparable risk, albeit at a higher price tag and higher portfolio churn. Equal weighting isn’t everyone’s cup of tea, but the numbers on a trailing 10-year basis, which encompasses a full business cycle of stress testing, are strong enough to give advocates of the strategy plenty of ammunition for arguing their cause.
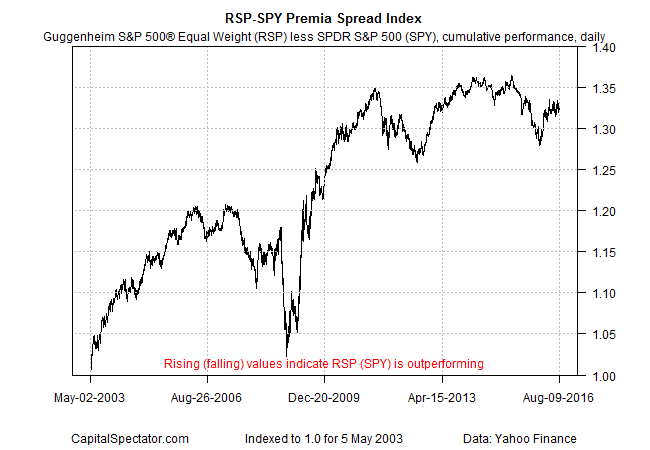
For another perspective, the next chart below compares RSP with SPY in terms of the cumulative daily return spread between the two ETFs. When the spread index is rising, RSP is outperforming. Although equal weighting suffered in relative terms during the 2008-2009 financial crisis, RSP regained its footing soon after and has posted impressive results overall since its launch in 2003.
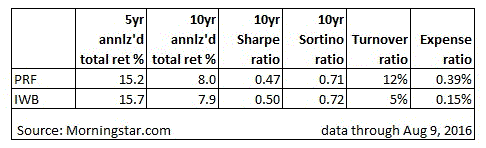
Now let’s review the PowerShares FTSE RAFI US 1000 Portfolio (PRF), which weights stocks based on several fundamental metrics in search of relatively undervalued companies and weighting those names accordingly. The benchmark is the Russell 1000 Index, which is comparable to the S&P 500 for targeting large-cap US equities. But in this case, the performance results don’t look particularly compelling. Although PRF eked out a tiny edge over the iShares Russell 1000 (IWB) for the trailing 10-year period, the fund trailed IWB for the past five years. The risk profile of the two funds is comparable, but the lack of a clear return edge over the past decade raises doubts about whether PRF’s higher expense ratio and portfolio turnover is worth the price.
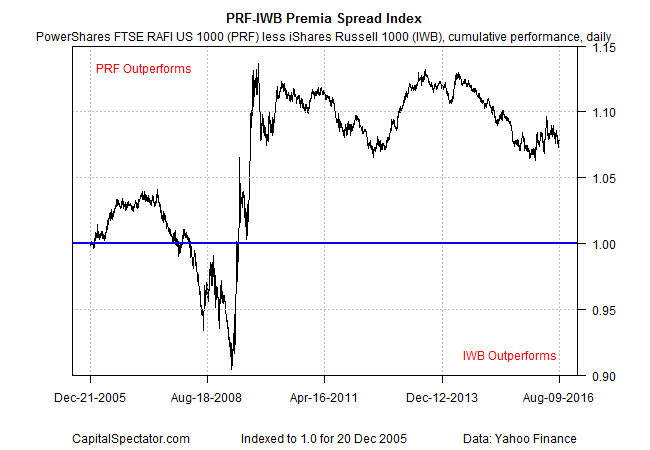
Reviewing the cumulative daily spread for PRF vs. IWB since the former’s 2005 launch also paints a mixed picture vs. the stronger results noted above for RSP over SPY. Although PRF has maintained a performance premium vs. IWB for the last decade-plus, the advantage looks a bit tenuous.
To be fair, the analysis above merely scratches the surface for analyzing RSP and PRF. If we were seriously considering these funds, we might also look for less-expensive fund alternatives for comparison. For RSP, given its smaller-cap bias via equal weighting, one might review a pairing of SPY with a small-cap ETF vs. RSP. For PRF, which has a value bias, perhaps there’s a less-expensive large-cap value ETF that serves as a proxy.
Another possibility is sampling the return histories of RSP and PRF to simulate multi-decade results. In addition, there are many more risk metrics beyond Sharpe ratio and Sortino ratio for quantifying risk.
Ultimately, minds will differ on the pros and cons of RSP and PRF. But as challenging as this type of analysis can be with only a decade-plus of real-world track records, it’s a walk in the park compared with reviewing factor funds with, say, only three years of history.
Disclosure: None.


