
Tectonic Forces Create Shifts In The Market-Scape
30 million years ago, many islands surrounded by channels were subterranean. Then, tectonic forces rotated those islands so they eventually uplifted from the sea.
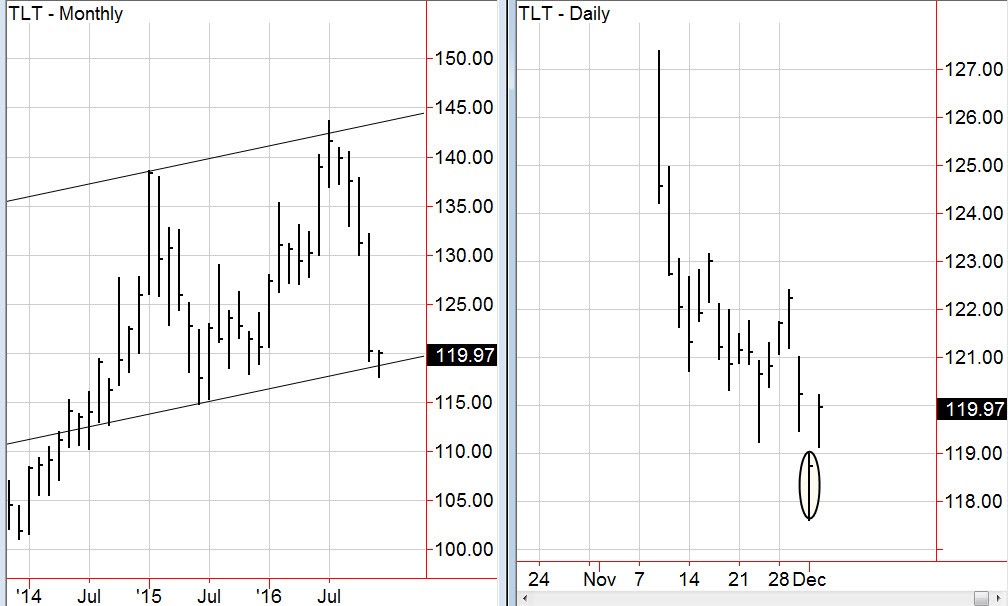
Above, we see a similar story. What existed underwater some 30 million years ago, Friday suddenly emerged as a potential island bottom (exhaustion gap) on the daily chart.
For accuracy’s sake, a true island bottom happens at new all-time lows. Since the recent low in TLTs is nowhere near an all-time low, that makes the island in the TLT’s technically an exhaustion gap.
For poetic license, I like the combination of islands and channels. However, even if more exhaustion than island, this sort of gap can still turn out a powerful reversal pattern.
The chart I have repeatedly featured for the last 2 weeks (and really since last August when the channel top formed), is of the 20+ Year Long Treasury Bonds (TLT).
The side by side monthly and daily charts illustrate the tectonic forces that if confirm, triggered the rotation in bonds.
Unless erosion (or the gradual process that changes the look of an island) occurs, what are the market implications if TLTs have truly bottomed?
Taking a closer look, the channel bottom on the monthly chart looks as though it did the classic trap-the-bears head-fake.
Breaking beneath the channel line last Thursday, on Friday, after the stellar jobs report, TLTs gapped higher back above that channel line. If this continues to play out, the mirror image of the fake-out-for-the-bulls back in August, becomes picture perfect.
A possible bottom in bonds will prove that the Fed’s expected interest rate hike of .25% is already discounted in the market. Naturally, a more substantial raise could indeed cause the TLTs to erode quickly.
If the TLTs confirm, we might expect the dollar to soften further. That in turn will help the metals, agricultural and soft commodities rise from their underwater precipice.
Nonetheless, interest rates and their impact have INTERESTingly taken an overall backseat to what is now known as the “Trump” rally.
Therefore, prudent to keep eyes on the Modern Family sectors as well, especially Transportation and Regional Banks. Both have well outperformed Retail and Biotechnology.
Should that disparity endure, follow the lead of the islands that continue to rise from their channels or those that continue to erode into the deep.
S&P 500 (SPY) Inside day. Unless this clears 221.83, 218 support and 220 pivotal.
Russell 2000 (IWM) Inside day. A correction to 126 might be in store unless this retakes 134.
Dow (DIA) Sitting under resistance but no damage done
Nasdaq (QQQ) 116.75 resistance. 110.50 area support
KRE (Regional Banks) Inside day. 52.15 support
SMH (Semiconductors) Inside day. However, did retake the 50 DMA for an unconfirmed return to Bullish. 68.65 pivotal
IYT (Transportation) Inside day. 161.50 support.
IBB (Biotechnology) Wouldn’t you know it? After another visit to the 200-week moving average, it held. 268.55 pivotal
XRT (Retail) Regained 45.50 the monthly support. Could see a move down to 42.00 if cannot recapture 46.00
GLD (Gold Trust) A low volume reversal pattern in the works. Better to watch TLTs
GDX (Gold Miners) Looks better than gold with 3 bottoms to trade from
USO (US Oil Fund) 10.80 the new support area to hold. Inside day which is a good sign
TLT (iShares 20+ Year Treasuries) If the channel does what it could, it will fail the bottom, trap the bears and then head right back above for a rally.
UUP (Dollar Bull) Correction time unless clears 26.34. 25.80 in focus
Disclosure: None.


