
Technically Speaking: "Will Santa Visit Broad & Wall?"
In this past weekend’s missive, “Stuck In The Middle (Range) With You,” I discussed the view from John Murphy via Stockcharts.com that the S&P 500 may have more downside to come. To wit:
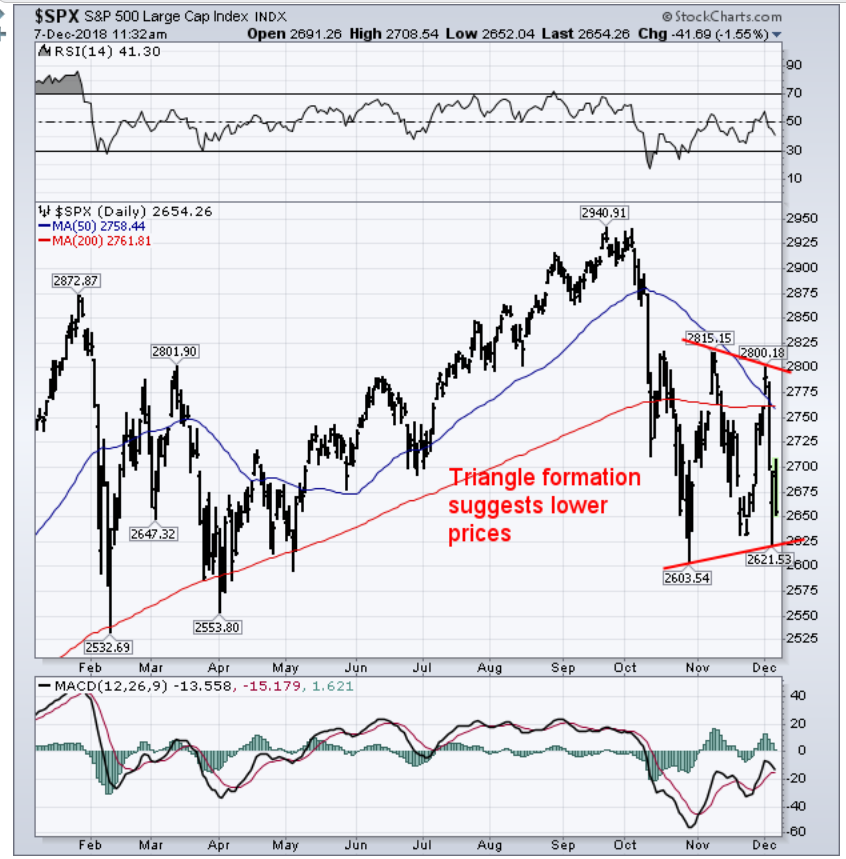
The daily bars in the chart shows the S&P 500 retesting previous lows formed in late October and late November. And it’s trying to hold there. The shape of the pattern over the past two months, however, isn’t very encouraging. Not only is the SPX trading well below its 200-day average. The two red trendlines containing that recent sideways pattern have the look of a triangular formation (marked by two converging trendlines). Triangles are usually continuation patterns. If that interpretation is correct, technical odds favor recent lows being broken.
If that happens, that would set up a more significant test of the lows formed earlier in the year. Other analysts on this site (besides myself) have also been writing about that possibility. That would lead to a major test of the viability of the market’s long-term uptrend.”
Yesterday, the market opened flattish as concerns over the “Huawei Incident” continue to linger. Via Zerohedge:
“China warned both Canada and the US over Huawei CFO’s arrest, warning of ‘retaliation’ and ‘further action’, with the US countering with ‘hard deadlines’ and concerns of ‘predatory behavior.’)”
But it isn’t just China that is the issue.
“Here’s a non-exhaustive list of potential risk-off drivers hanging over Monday’s open (as succinctly summarized by Bloomberg’s Garfield Reynolds):
- China summons U.S. Ambassador over the Huawei case
- Trump Chief of Staff Kelly to leave, amid a welter of fresh Mueller developments
- China reports weaker trade and inflation data
- May pushes ahead on Brexit vote despite Cabinet, DUP opposition
- Soggy U.S. payrolls, though not soggy enough to stop a December Fed hike
- France protests intensify, raising concerns of economic damage”
The biggest concern currently, from a technical perspective, is the important support levels the markets are currently testing.
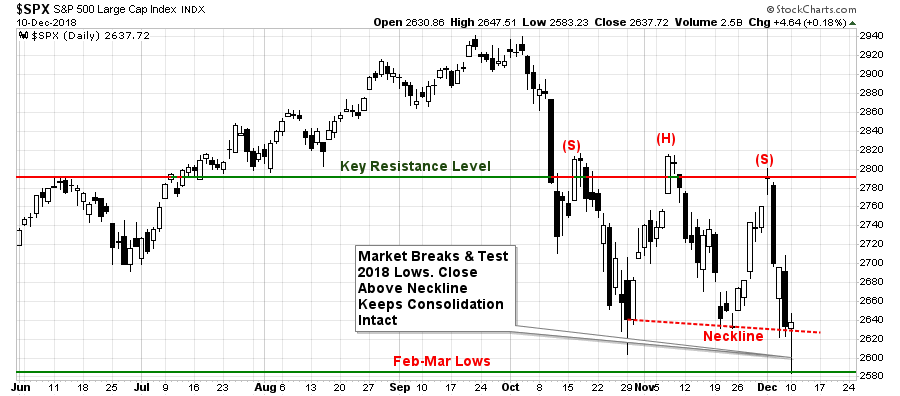
Most importantly, the most recent failure at key resistance levels has set the market up to complete the formation of a ‘head and shoulder’ process. This is a topping pattern that would suggest substantially lower asset prices going into 2019 ‘IF,’ and this is a key point, ‘IF’ it completes by breaking the lower ‘neckline.’”
On Monday, the market did indeed break the “neckline” and successfully tested the 2018 lows. However, since the market rallied back, and closed, above that support level the “break” is not valid. This keeps the current consolidation range intact for now.
While the market was able to hold that level on Monday, the overall market action was very poor. More importantly, as shown in the series of charts below, the technical backdrop is not suggestive of a market which has completed its corrective process as of yet.
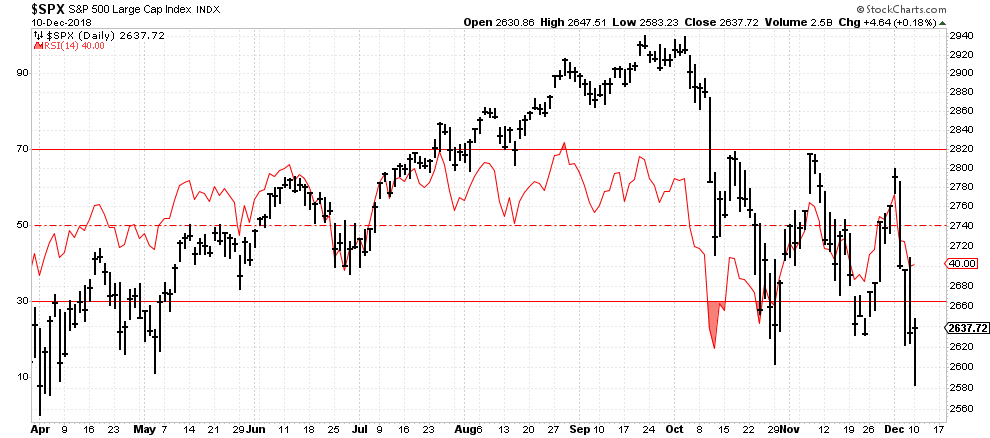
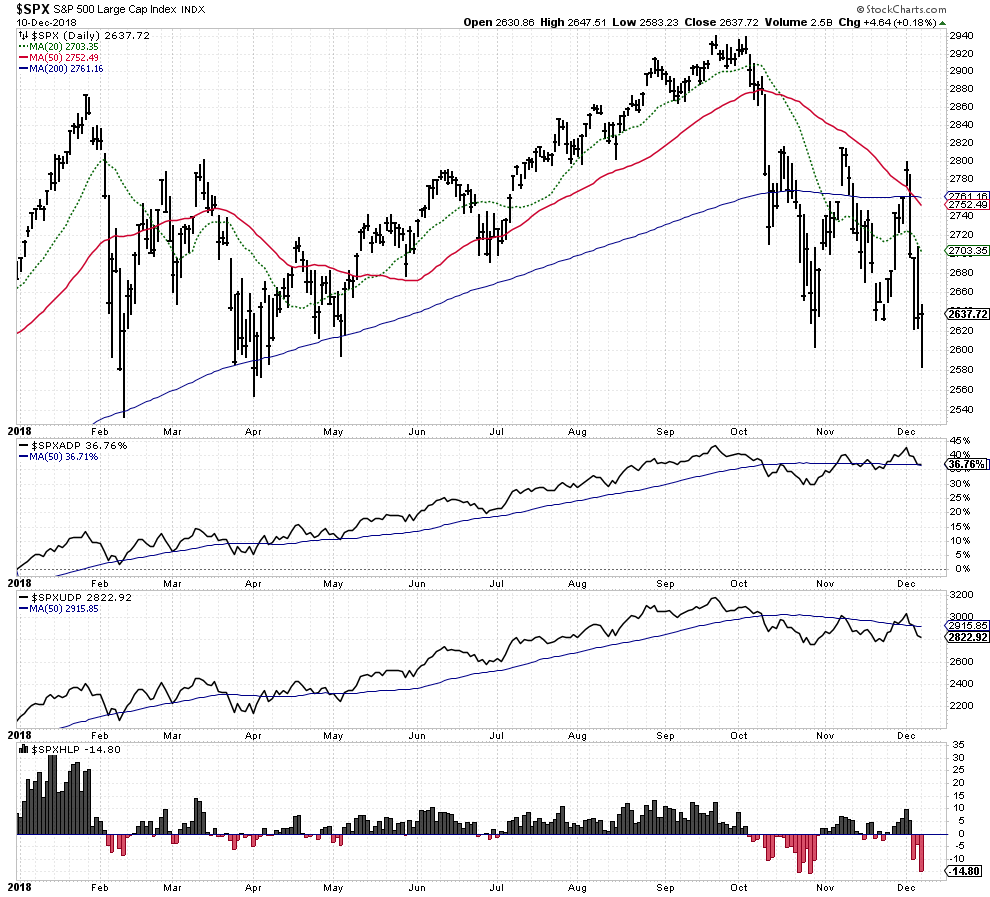
The daily Relative Strength Index (RSI) is NOT oversold as of yet despite the market testing recent lows.
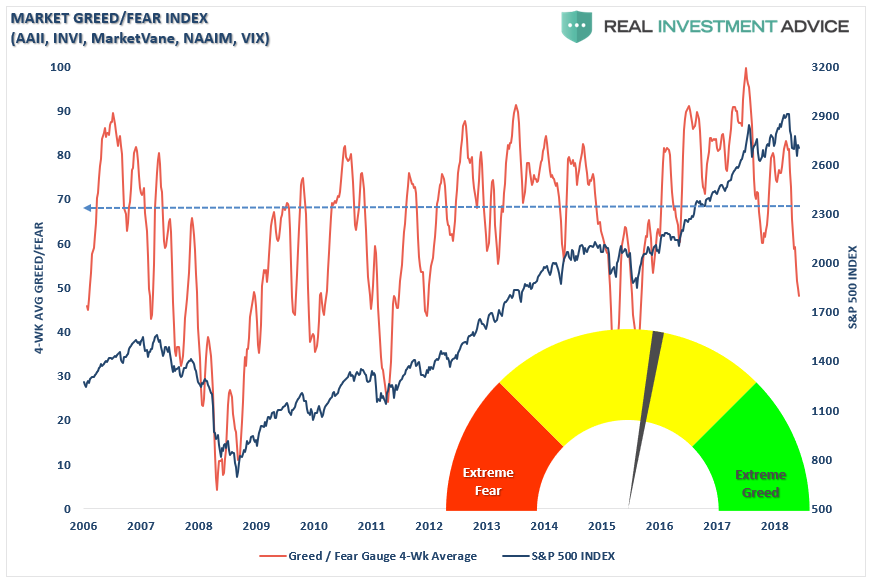
Sentiment is not grossly “bearish” yet, either.
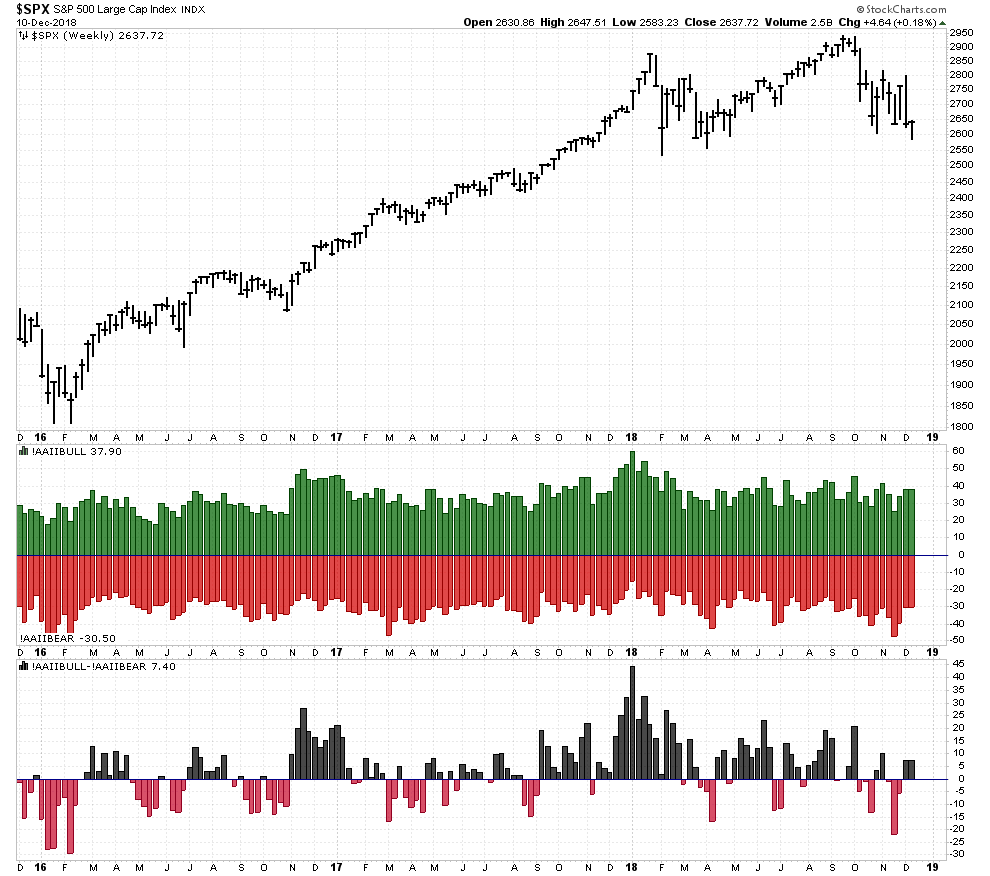
This is confirmed by our broad market fear/greed gauge which is the combined reading of AAII, INVI, MarketVane, NAAIM, and the volatility index. Which the greed levels have been reduced, we are not yet at levels which have historically represented more lasting market bottoms.
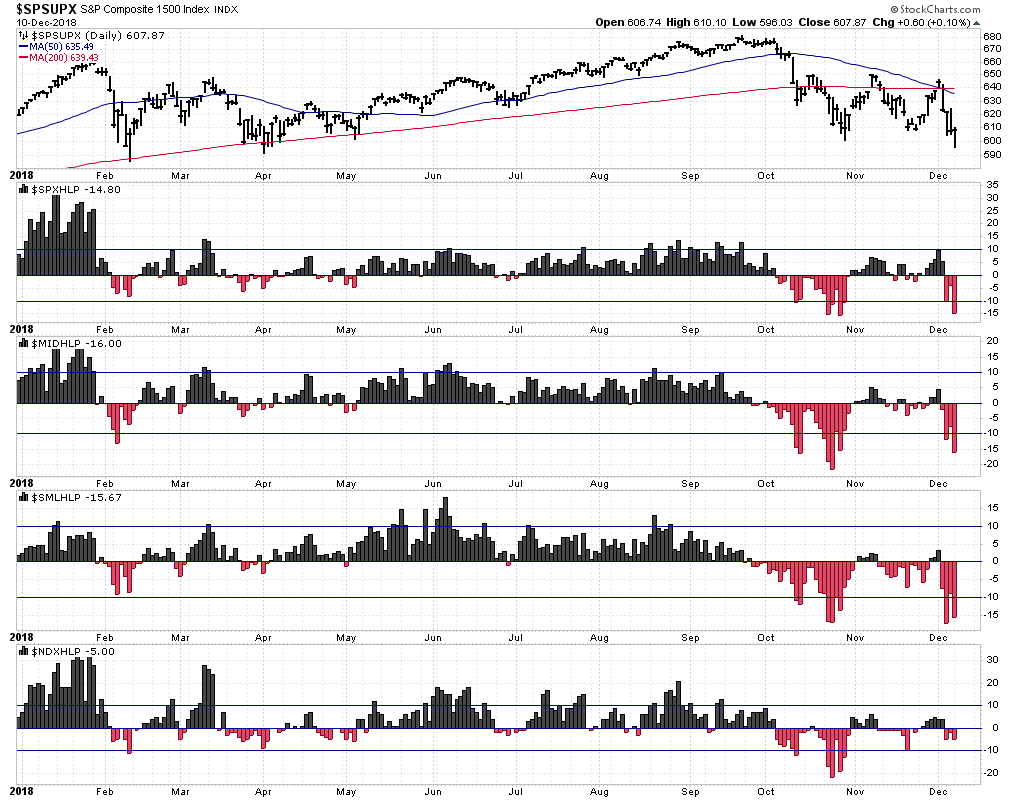
The broad market. as measured by the S&P 1500 (comprised of large-cap S&P 500, mid-cap S&P 400, and small-cap S&P 600) has currently registered a cross of the 50-dma below the 200-dma which suggests further downward pressure on prices. However, with the high-low percentages plumbing recent “wash out” levels, the potential for a “reflex rally” is highly likely over the next couple of weeks. This is supportive of a “Santa Rally” as we will discuss momentarily.
The advance-decline percentages and volumes are also turning lower which, with the market already at recent lows and on important support, suggests pressure remains to the downside as well.
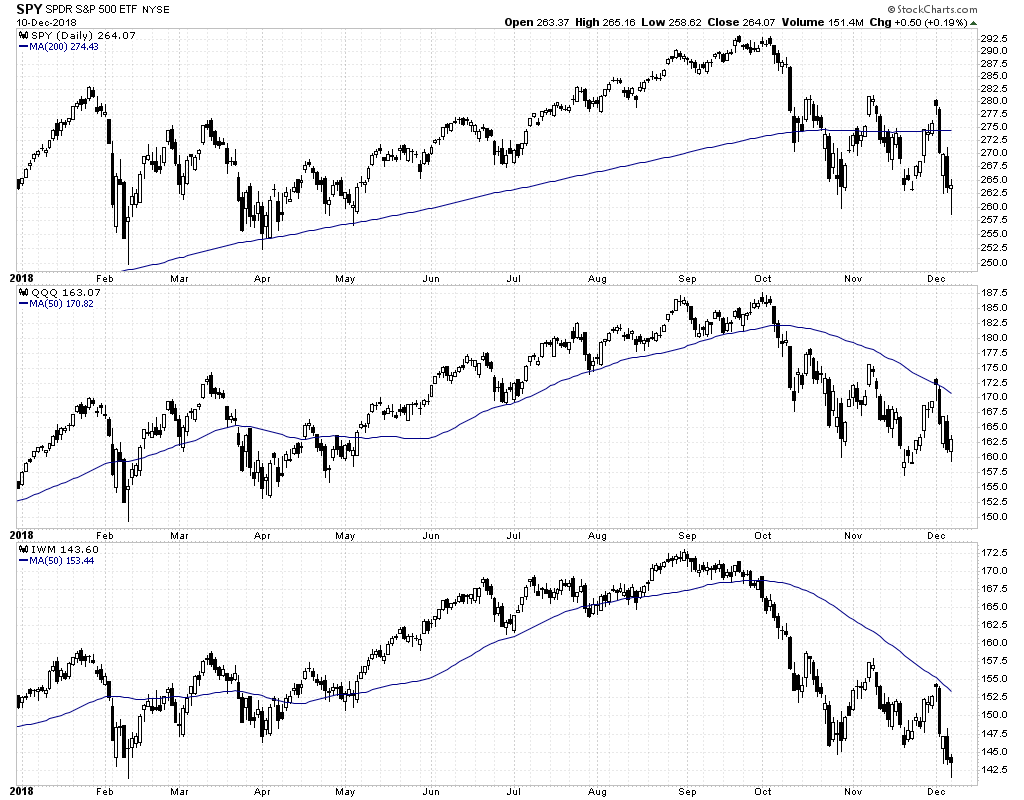
An important change, and warning, for investors is that unlike the sell-off in February which tested the long-term moving average and traded ABOVE it, which confirms the bullish trend, the major markets are now all trading BELOW that long-term average which is bearish.
Technically, the backdrop of the market is about as poor as it can get currently. The majority of the shorter-term signals are bearish and longer-term signals are turning lower as well.
It’s Now Or Never For Santa
However, as noted above, with the market oversold, and flirting with important support levels, it is now or never for the traditional “Santa Rally.” As Michael Lebowitz noted last week:
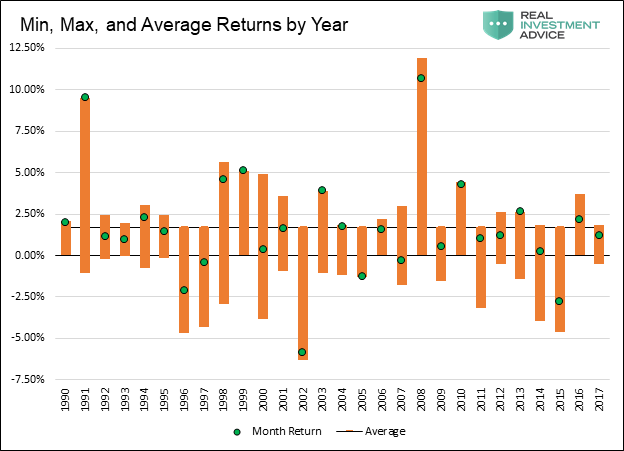
“For this analysis, we studied data from 1990 to current to see if December is a better period to hold stocks than other months. The answer was a resounding ‘YES.’ The 28 Decembers from 1990 to 2017, had an average monthly return of +1.70%. The other 11 months, 308 individual observations over the same time frame, posted an average return of +0.62%.
The following graph shows the monthly returns as well as the maximum and minimum intra-month returns for each December since 1990. It is worth noting that more than a third of the data points have returns that are below the average for the non-December months (+0.62%). Further, if the outsized gains of 2008 and 1991 are excluded, the average for December is +1.05%. While still better than the other months, it is not nearly as impressive as the aggregate 1.70% gain.”
“Next, we analyzed the data to explore if there are periods within December where gains were clustered. The following two graphs show, in orange, aggregate cumulative returns by day count for the 28 Decembers we analyzed. In the first graph, returns are plotted alongside daily aggregated average returns by day. Illustrated in the second graph is the percentage of positive days versus negative days by day count along with returns.”
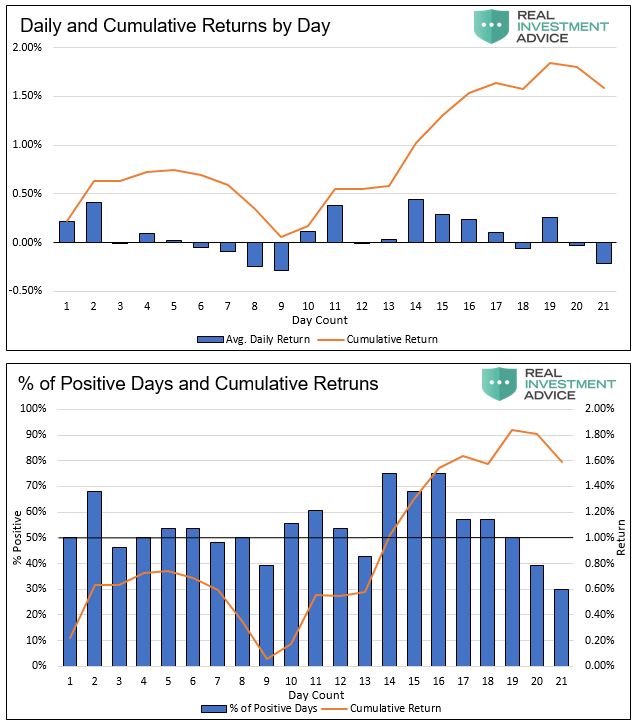
Here is the important point of that analysis:
IF “Santa” is going to visit “Broad & Wall” this year, it will most likely occur between the 10th through the 17th trading days of the month. Such would equate to Friday, December 14th through Wednesday, December 26th.
As I have discussed previously, with mutual funds finishing up their annual distributions, portfolio managers and hedge funds will likely look to “Stuff Their Stockings” of highly visible positions to have them reflected in year-end statements.
While the current oversold condition is supportive of a rally over the next couple of weeks, that does not mean this is a “stocking” you should shove everything into. Given the overall technical backdrop, any rally may be short-lived going into 2019 unless some of the pressure from weaker economic data, Brexit, Washington politics, “trade wars”, balance sheet reductions, and softer-earnings growth is relieved.
Therefore, here are the rules for the “Santa Rally.”
Rules For “Santa Rally”
If you are long equities in the current market, we continue to recommend following some basic rules of portfolio management.
- Tighten up stop-loss levels to current support levels for each position.
- Hedge portfolios against major market declines.
- Take profits in positions that have been big winners
- Sell laggards and losers
- Raise cash and rebalance portfolios to target weightings.
Notice, nothing in there says “sell everything and go to cash.”
Remember, our job as investors is actually pretty simple – protect our investment capital from short-term destruction so we can play the long-term investment game. Here are our thoughts on this.
- Capital preservation
- A rate of return sufficient to keep pace with the rate of inflation.
- Expectations based on realistic objectives. (The market does not compound at 8%, 6% or 4%)
- Higher rates of return require an exponential increase in the underlying risk profile. This tends to not work out well.
- You can replace lost capital – but you can’t replace lost time. Time is a precious commodity that you cannot afford to waste.
- Portfolios are time-frame specific. If you have a 5-years to retirement but build a portfolio with a 20-year time horizon (taking on more risk) the results will likely be disastrous.
With forward returns likely to be lower and more volatile than what was witnessed over the last decade, the need for a more conservative approach is rising. Controlling risk, reducing emotional investment mistakes and limiting the destruction of investment capital will likely be the real formula for investment success in the decade ahead.
This brings up some very important investment guidelines that I have learned over the last 30 years.
- Investing is not a competition. There are no prizes for winning but there are severe penalties for losing.
- Emotions have no place in investing.You are generally better off doing the opposite of what you “feel” you should be doing.
- The ONLY investments that you can “buy and hold” are those that provide an income stream with a return of principal function.
- Market valuations (except at extremes) are very poor market timing devices.
- Fundamentals and Economics drive long-term investment decisions – “Greed and Fear” drive short-term trading. Knowing what type of investor you are determines the basis of your strategy.
- “Market timing” is impossible– managing exposure to risk is both logical and possible.
- Investment is about discipline and patience. Lacking either one can be destructive to your investment goals.
- There is no value in daily media commentary– turn off the television and save yourself the mental capital.
- Investing is no different than gambling– both are “guesses” about future outcomes based on probabilities. The winner is the one who knows when to “fold” and when to go “all in”.
- No investment strategy works all the time. The trick is knowing the difference between a bad investment strategy and one that is temporarily out of favor.
As an investment manager, I am neither bullish or bearish. I simply view the world through the lens of statistics and probabilities. My job is to manage the inherent risk to investment capital. If I protect the investment capital in the short term – the long-term capital appreciation will take of itself.
Disclosure: The information contained in this article should not be construed as financial or investment advice on any subject matter. Real Investment Advice is expressly disclaims all liability ...
more

