
Technically Speaking: Will Santa Come To "Broad & Wall?"
In this past weekend’s missive, I went dove into the current backdrop of the markets, bullish exuberance, interest rates and oil prices. Of particular note was the current bifurcation of the market as shown in the sector rotation chart below.
“The problem with the breadth of the advance is significant. As shown in the sector rotation chart, the current rally has been extremely bifurcated. Such extreme deviations in performance tend not to last long and tend to have rather nasty reversions.”
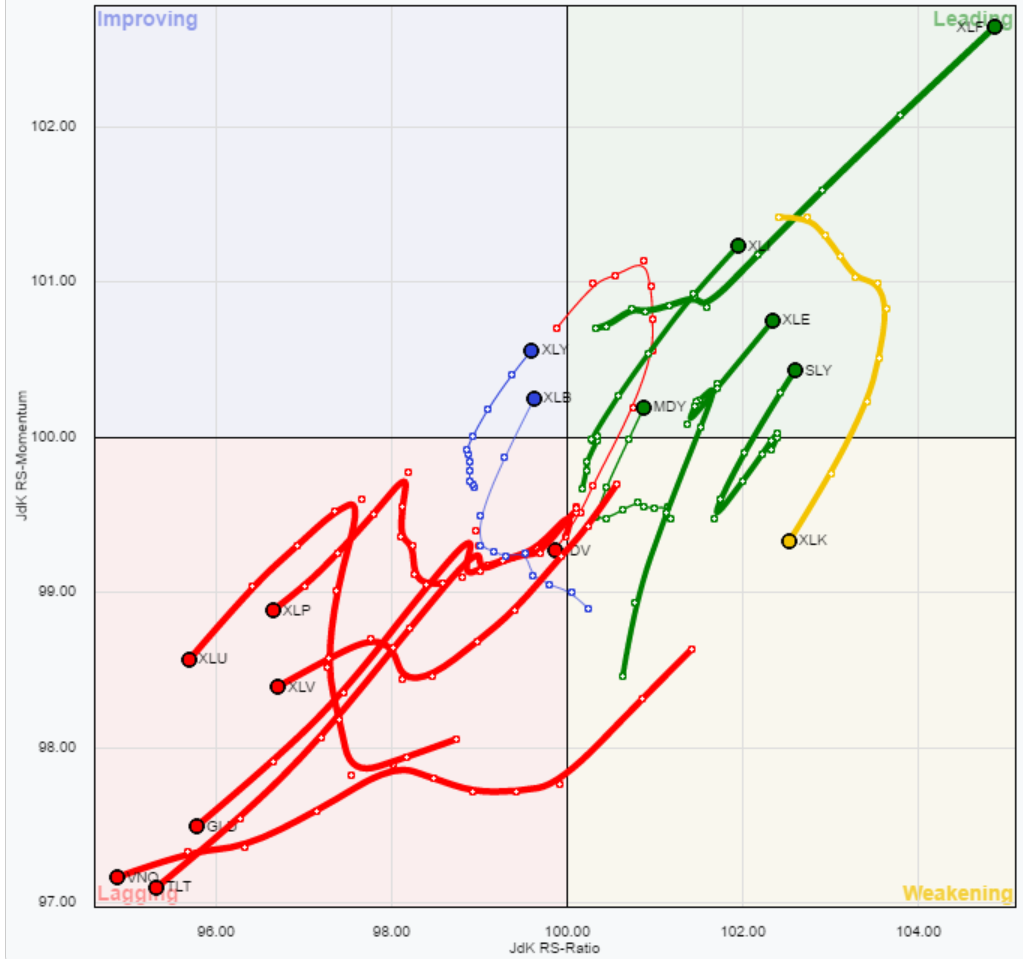
The importance of understanding the nature of reversions is critical for investors. Markets rarely move in one direction for very long, notwithstanding overall trends, without a correction process along the way. While the chart below shows this clearly for the overall market, it applies to individual sectors of the market as well.
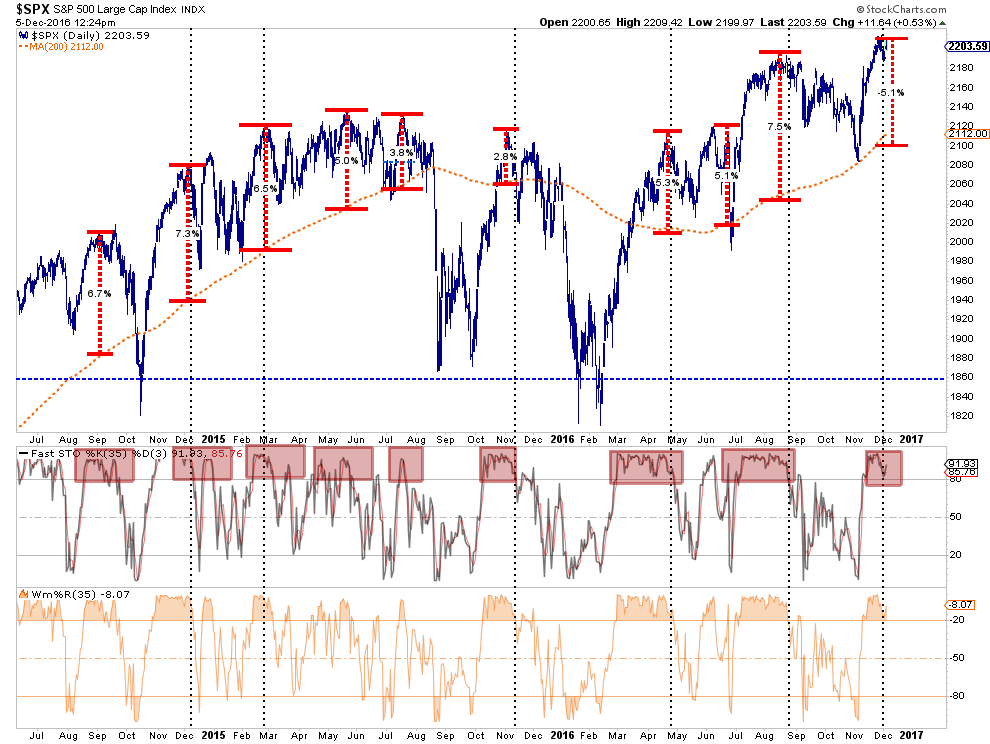
Importantly, notice the bottom two part of the chart above. When there is a simultaneous culmination of overbought conditions combined with a more extreme deviation, corrections usually occur back to the underlying trend.
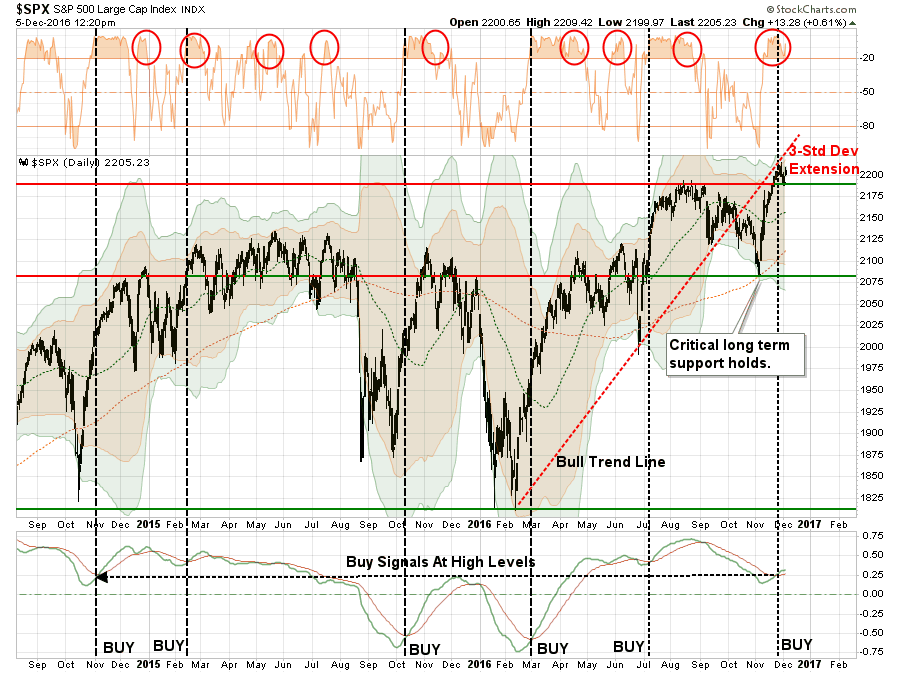
This can also be seen in the next chart as well. While the “Trump Rally” has pushed asset prices higher and triggered a corresponding “buy signal,” that signal has been triggered at very high levels combined with a very overbought condition. Historically, rallies following such a combination have not been extremely fruitful.
Stepping back for just a moment, while the markets continue to ignore the risks of “Brexit”, “Trumponomics,” “Italexit,”rising interest rates, a stronger dollar and valuations in the short-term, history suggests the consequences of excessive risk-taking have not been resolved.
As shown in the very long-term chart below (back to 1925), the markets are pushing long-term overbought conditions, combined with high valuation levels, that have historically yielded low-return outcomes.
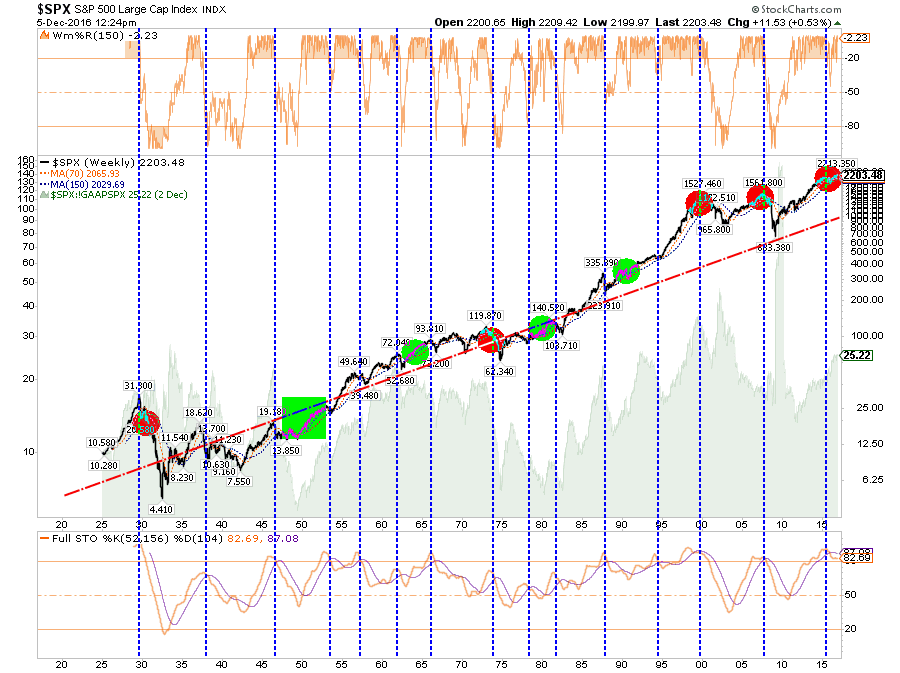
Of course, the timing and the catalysts of a long-term reversion to the mean are unknowable. However, throughout history, they have been repeated with regularity, and ignoring fundamental realities will likely prove to be a bad decision for most.
One other interesting tidbit in this regard came from a dear friend of mine over the weekend as we discussed market outlooks and consequences. The chart below is the ratio of the price of stocks relative to the price of bonds. When there is extreme bullishness in the equity markets, the ratio rises to high levels as investors pile into “risk” based assets over “safety.” Outcomes, again, have tended not to be good.
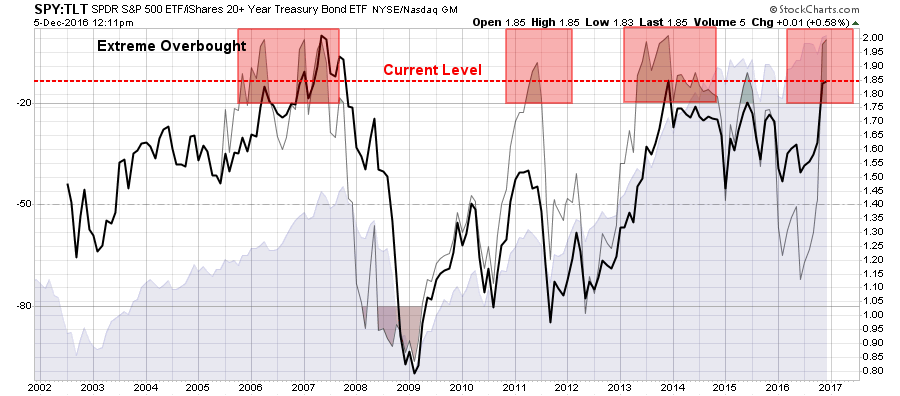
The point here is that while asset prices have certainly surged since the election, there is little room for errors in the future. But that is a story for another day.
In the meantime, it’s “Santa Claus” hats for everyone.
It’s Now Or Never For Santa
With the market now back to overbought conditions, it is now or never for the traditional “Santa Rally.”
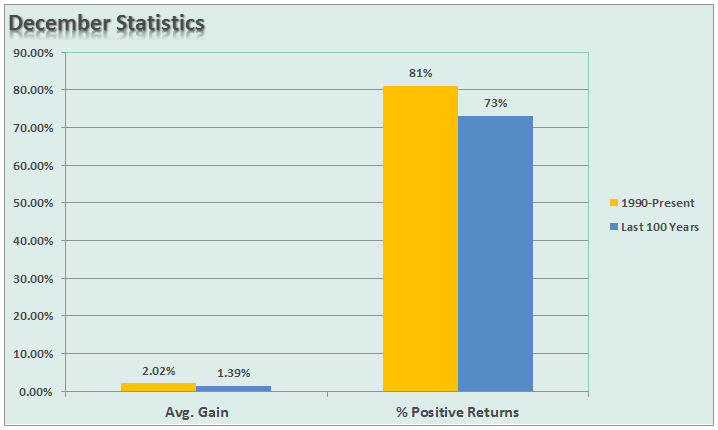
If we go back to 1990, the month of December has had average returns of 2.02% with positive returns 81% of the time. Over the past 100 years, those numbers fall slightly to a 1.39% average return with positive returns 73% of the time. Statistically speaking, the odds are high that the market will muster a rally over the few weeks headed into the end of the year.
As discussed over the last couple of weeks, this is not to be unexpected as portfolio managers and hedge funds “Stuff Their Stockings” of highly visible positions to have them reflected in year-end statements.
Come January, it is potentially a different story as we saw last year as the Federal Reserve hiked rates at their December meeting. The chart below shows the December rally over the last 3-years followed by a January sell-off.
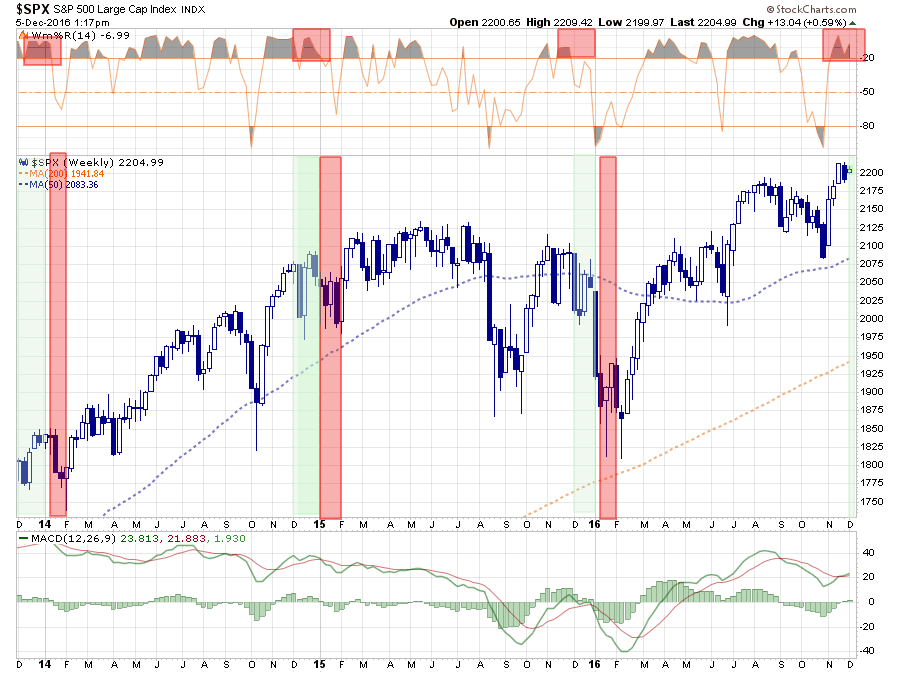
However, given the spike of the recent advance and rally into the end of the year may be more subdued from this point forward. As I discussed in detail recently, the underlying technical underpinnings are pushing extremes on many levels and are more akin to market peaks than the beginning of new bull market advances.
Buybacks At A Limit?
One of the biggest drivers to earnings growth has not been revenue growth but share buybacks. As I discussed previously:
“One of the primary tools used by businesses to increase profitability has been through the heavy use of stock buybacks. The chart below shows outstanding shares as compared to the difference between operating earnings on a per/share basis before and after buybacks.”
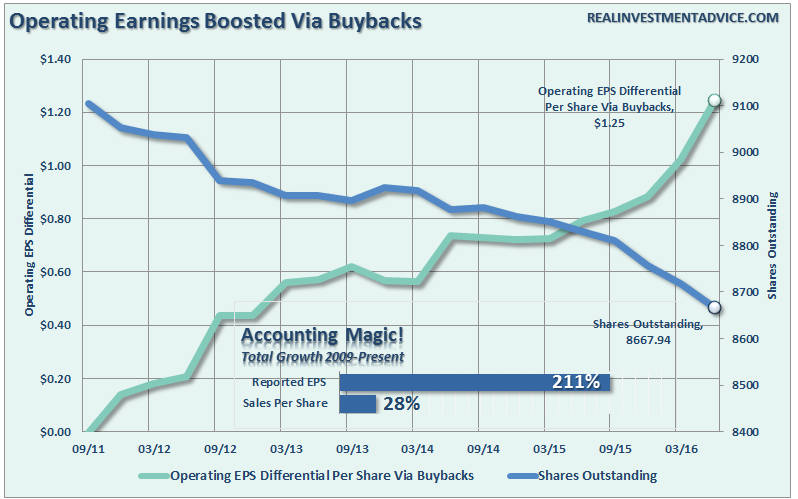
“The problem with this, of course, is that stock buybacks create an illusion of profitability. If a company earns $0.90 per share and has one million shares outstanding – reducing those shares to 900,000 will increase earnings per share to $1.00. No additional revenue was created, no more product was sold, it is simply accounting magic. Such activities do not spur economic growth or generate real wealth for shareholders.”
The problem with the use of share buybacks to boost earnings is that there is a finite limit to the number of shares you can buy back until you become a privately owned company again. Furthermore, there is a limit to share buybacks from the availability of either “free cash” OR availability of cheap debt with which to repurchase shares. Both of those may become a problem in the next year.
As David Bianco recently stated:
“20% of the S&P 500’s earnings per share will come from buybacks. By shrinking the amount of stock outstanding, earnings are boosted on a per share basis.
Strains on maintaining buybacks (even dividends) will be at Energy, Industrials, and Materials. But Healthcare and most of big cap Tech should be in a very good position to maintain buybacks or even boost them a bit as [free cash flow] at these sectors is healthy and these companies still very much have access to bank lines of credit and debt capital markets and low interest rates.”
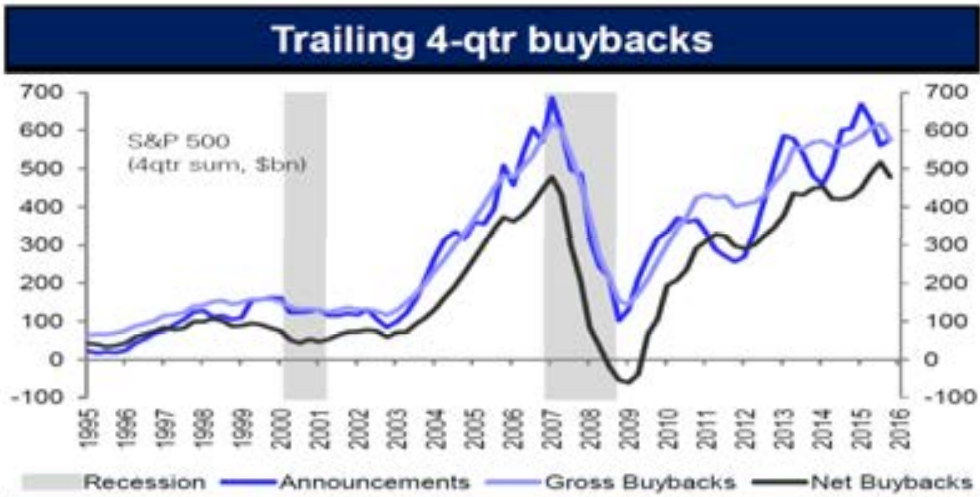
As noted buybacks are back to levels last seen at the peak of the last major bull market. More importantly, with interest rates rising pushing borrowing costs higher, the net benefit of share buybacks will become less attractive. Combined with tighter bank lending standards, and the availability of free capital to buy back shares is more limited.
This can be seen in the following two charts which show the deterioration in the financial health of corporate balance sheets since the “purge” of the financial crisis. Leverage is back.
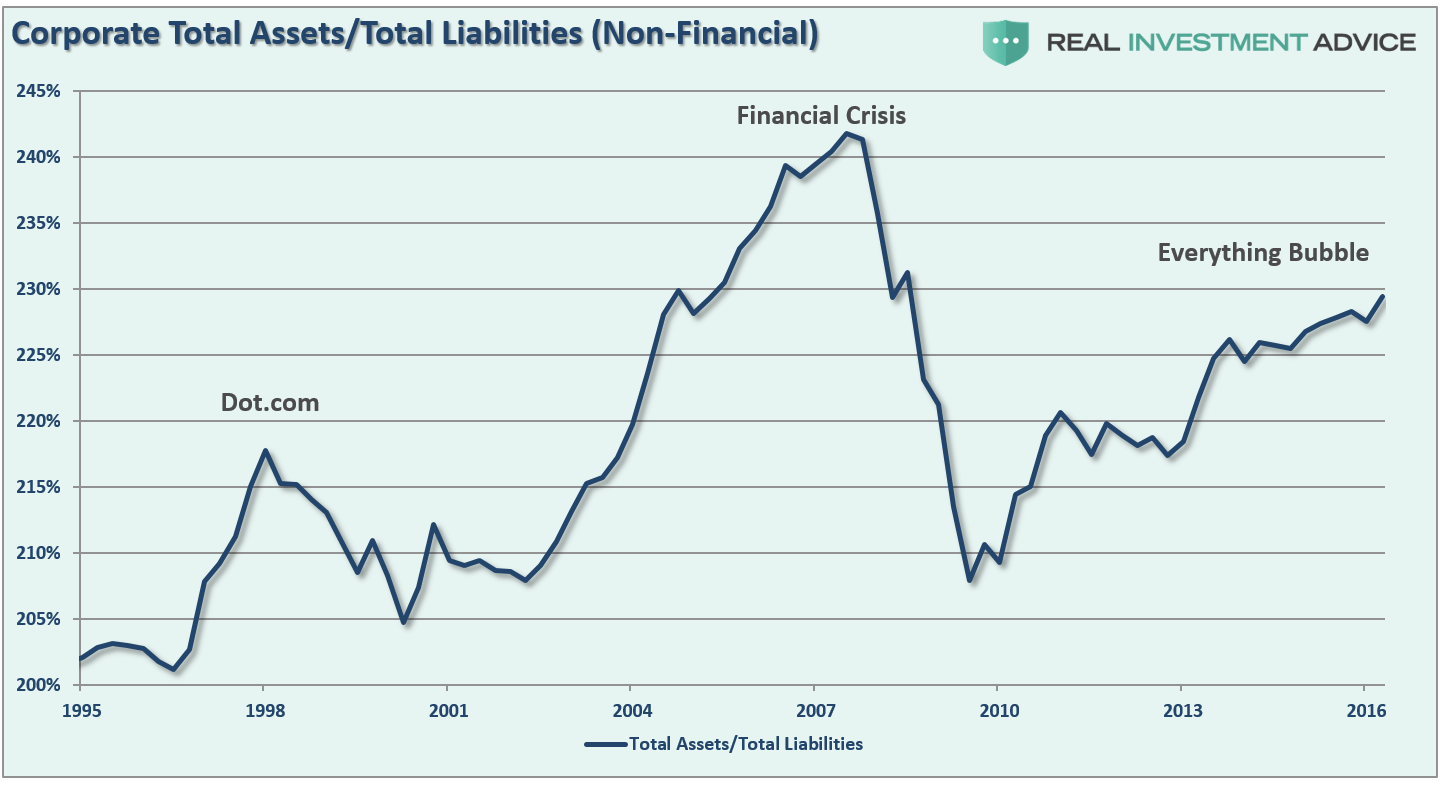
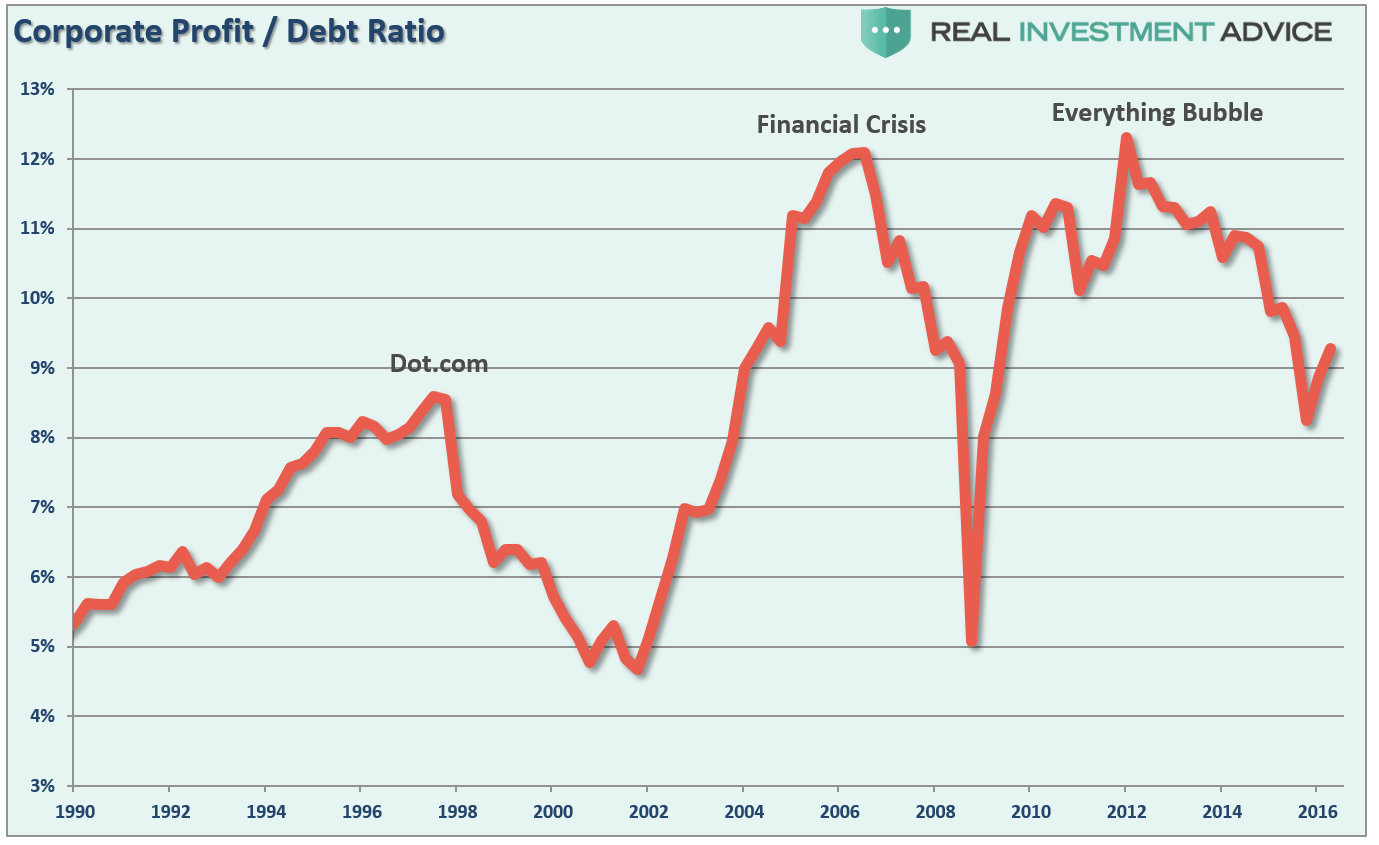
While this time could certainly be different, there are many similarities that suggest it won’t be.
My feeling is that if Santa does come to Wall Street, it is probably a good opportunity to get a little more defensive heading into a year that has historically lower odds of being a winner.
As an investor, you should remember that making money in the market is only one-half of the job. Keeping it is the other.
“We can not direct the wind, but we can adjust the sail.” – Anonymous
Disclosure: The information contained in this article should not be construed as financial or investment advice on any subject matter. Streettalk Advisors, LLC expressly disclaims all liability in ...
more

