
Technically Speaking: This Is Nuts

Since the election, markets have accelerated the pace of the advance as shown in the chart below.

The advance has had two main storylines to support the bullish narrative.
- It’s an earnings recovery story, and;
- It’s all about tax cuts.
There is much to debate about the earnings recovery story but as I showed previously, and to steal a line from my friend Doug Kass, this “new meme increasingly resembles ‘Group Stink.’” To wit:
“Despite many who are suggesting this has been a ‘rational rise’ due to strong earnings growth, that is simply not the case as shown below. (I only use ‘reported earnings’ which includes all the ‘bad stuff.’ Any analysis using “operating earnings” is misleading.)”
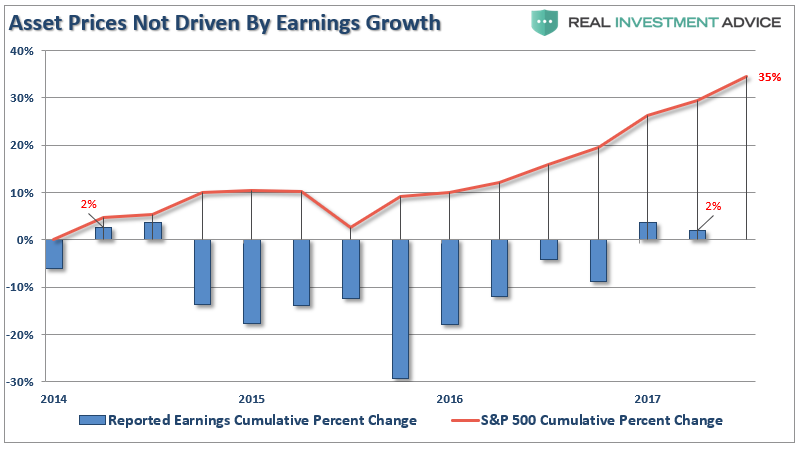
“Since 2014, the stock market has risen (capital appreciation only) by 35% while reported earnings growth has risen by a whopping 2%. A 2% growth in earnings over the last 3-years hardly justifies a 33% premium over earnings.
Of course, even reported earnings is somewhat misleading due to the heavy use of share repurchases to artificially inflate reported earnings on a per share basis. However, corporate profits after tax give us a better idea of what profits actually were since that is the amount left over after those taxes were paid.”

“Again we see the same picture of a 32% premium over a 3% cumulative growth in corporate profits after tax. There is little justification to be found to support the idea that earnings growth is the main driver behind asset prices currently.
We can also use the data above to construct a valuation measure of price divided by corporate profits after tax. As with all valuation measures we have discussed as of late, and forward return expectations from such levels, the P/CPATAX ratio just hit the second highest level in history.”

The reality, of course, is that investors are simply chasing asset prices higher as exuberance overtakes logic.
The second meme of “it’s all about tax cuts” is also not entirely accurate. The current rally, following the nearly 20% decline in early 2016 is actually an extension from the transition of “quantitative easing” from the Federal Reserve to the global Central Banks. What is clearly seen in the chart below is that as the Fed signaled the end of their QE program, and begin hiking interest rates, Global Central banks took the lead.
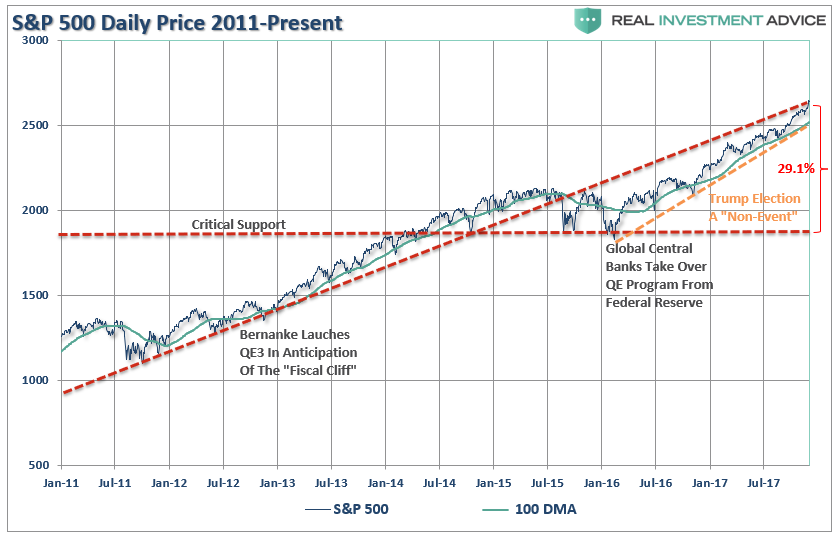
As noted, a correction back to critical support, the 2016 lows, would entail a 29.1% decline from current levels. More importantly, a decline of such magnitude will threaten to trigger “margin calls” which, as discussed previously, is the “time bomb” waiting to happen.
Here is the point. The “excuses” driving the rally are just that. The election of President Trump has had no material effect on the market outside of the liquidity injections which have exceeded $2 Trillion.
Importantly, on a weekly basis, the market has pushed into the highest level of overbought conditions on record since 2005. I have marked on the chart below each previous peak above 80 which has correlated to a subsequent decline in the near future.
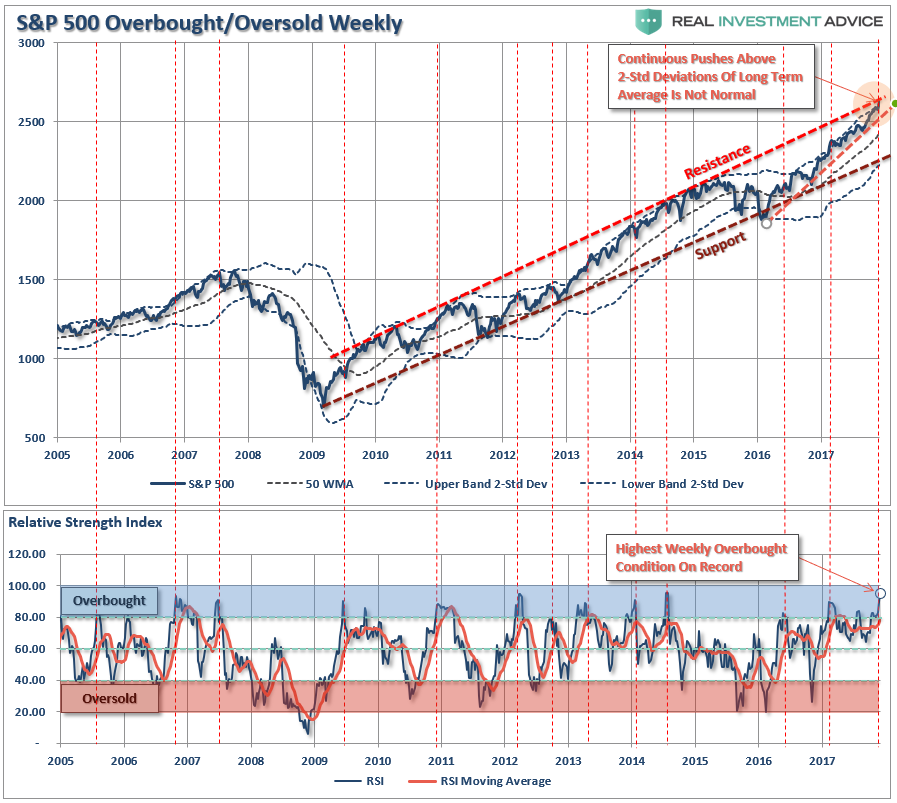
The problem for investors is not being able to tell whether the next correction will be just a “correction” within an ongoing bull market advance, or something materially worse. Unfortunately, by the time most investors figure it out – it is generally far too late to do anything meaningful about it.
As shown below, price deviations from the 50-week moving average has been important markers for the sustainability of an advance historically. Prices can only deviate so far from their underlying moving average before a reversion will eventually occur. (You can’t have an “average” unless price trades above and below the average during a given time frame.)
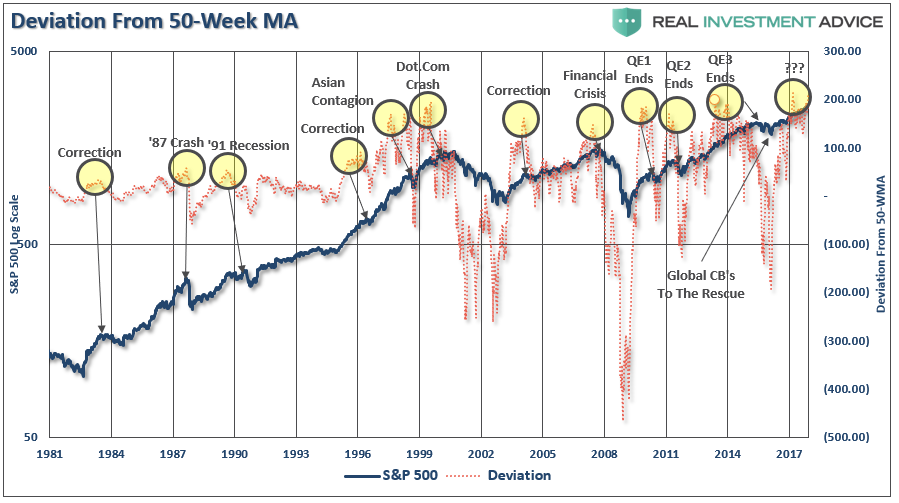
Notice that price deviations became much more augmented heading into 2000 as electronic trading came online and Wall Street turned the markets into a “casino” for Main Street.
At each major deviation of price from the 50-week moving average, there has either been a significant correction, or something materially worse.
This time is unlikely to be different.
Just how big could the next correction be?
As stated above, just a correction back to the initial “critical support” set at the 2016 lows would equate to a 29.1%decline.
However, the risk, as noted above, is that a correction of that magnitude would begin to trigger margin calls, junk bond defaults, blow up the “VIX ” short-carry and trigger a wave of automated selling as the algorithms begin to sell in tandem. Such a combination of events could conceivably push markets to either strong support at the previous two bull market peaks or to support at the 2011 peak which coincides with the topping formations of 2000 and 2007.
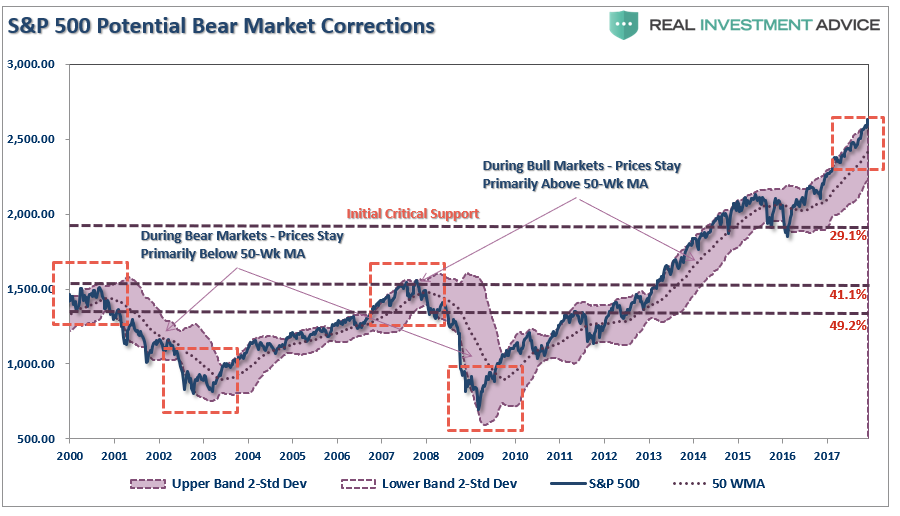
Such a correction would entail either a 41.1% to 49.2% decline.
I won’t even mention the remote, but real, possibility of a nearly 75% retracement to the previous lows of the last two “bear markets.”
That can’t happen you say?
It wouldn’t even match the decline following the 1929 crash of 85%.
Furthermore, as technical analyst J. Brett Freeze, CFA, recently noted:
“The Wave Principle suggests that the S&P 500 Index is completing a 60-year, five-wave motive structure. If this analysis is correct, it also suggests that a multi-year, three-wave corrective structure is immediately ahead. We do not make explicit price forecasts, but the Wave Principle proposes to us that, at a minimum, the lows of 2009 will be surpassed as the corrective structure completes.”
Anything is possible.
There are probabilities and possibilities.
Both can happen.
You play the probabilities, but prepare for the possibilities.
No one knows with certainty what the future holds which is why we must manage portfolio risk accordingly and be prepared to react when conditions change.
While I am often tagged as “bearish” due to my analysis of economic and fundamental data for “what it is” rather than “what I hope it to be,” I am actually neither bullish or bearish. I follow a very simple set of rules which are the core of my portfolio management philosophy which focus on capital preservation and long-term “risk-adjusted” returns.
As such, let me remind you of the 15-Risk Management Rules I have learned over the last 30-years:
- Cut losers short and let winner’s run. (Be a scale-up buyer into strength.)
- Set goals and be actionable. (Without specific goals, trades become arbitrary and increase overall portfolio risk.)
- Emotionally driven decisions void the investment process. (Buy high/sell low)
- Follow the trend. (80% of portfolio performance is determined by the long-term, monthly, trend. While a “rising tide lifts all boats,” the opposite is also true.)
- Never let a “trading opportunity” turn into a long-term investment. (Refer to rule #1. All initial purchases are “trades,” until your investment thesis is proved correct.)
- An investment discipline does not work if it is not followed.
- “Losing money” is part of the investment process. (If you are not prepared to take losses when they occur, you should not be investing.)
- The odds of success improve greatly when the fundamental analysis is confirmed by the technical price action. (This applies to both bull and bear markets)
- Never, under any circumstances, add to a losing position. (As Paul Tudor Jones once quipped: “Only losers add to losers.”)
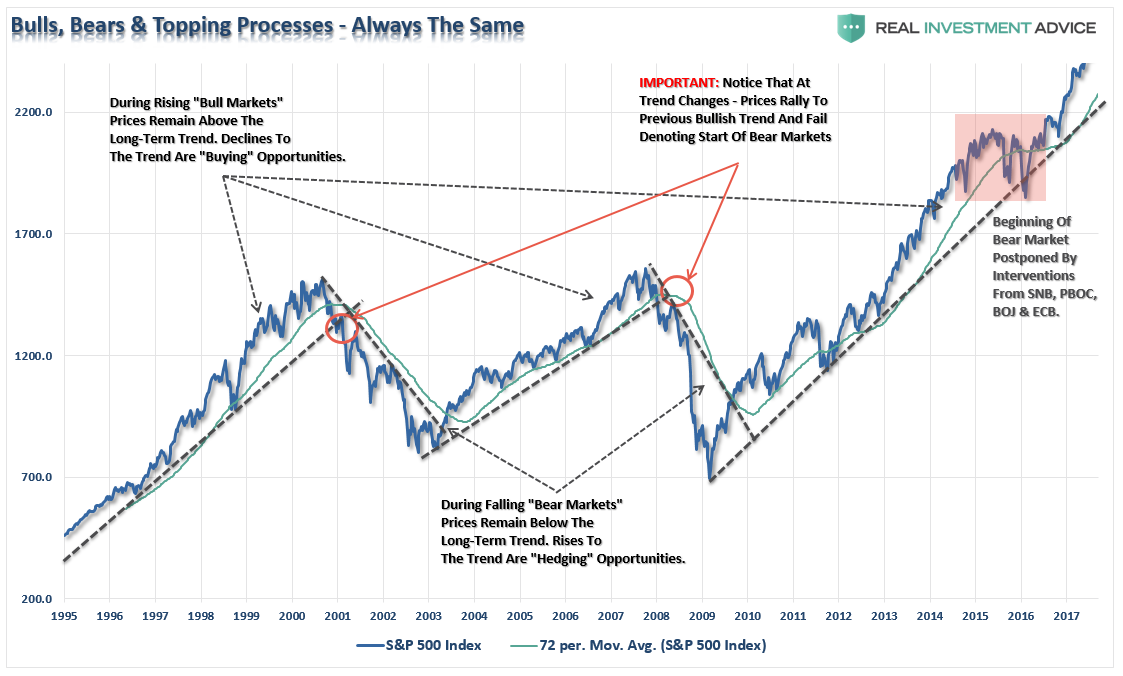
- Market are either “bullish” or “bearish.” During a “bull market” be only long or neutral. During a “bear market”be only neutral or short. (Bull and Bear markets are determined by their long-term trend as shown in the chart below.)
- When markets are trading at, or near, extremes do the opposite of the “herd.”
- Do more of what works and less of what doesn’t. (Traditional rebalancing takes money from winners and adds it to losers. Rebalance by reducing losers and adding to winners.)
- “Buy” and “Sell” signals are only useful if they are implemented. (Managing a portfolio without a “buy/sell” discipline is designed to fail.)
- Strive to be a .700 “at bat” player. (No strategy works 100% of the time. However, being consistent, controlling errors, and capitalizing on opportunity is what wins games.)
- Manage risk and volatility. (Controlling the variables that lead to investment mistakes is what generates returns as a byproduct.)
The current market advance both looks, and feels, like the last leg of a market “melt up” as we previously witnessed at the end of 1999. How long it can last is anyone’s guess. However, importantly, it should be remembered that all good things do come to an end. Sometimes, those endings can be very disastrous to long-term investing objectives.This is why focusing on “risk controls” in the short-term, and avoiding subsequent major draw-downs, the long-term returns tend to take care of themselves.
Everyone approaches money management differently. This is just the way I do it.
All I am suggesting is that you “something” as the alternative will much less beneficial.
Disclosure: The information contained in this article should not be construed as financial or investment advice on any subject matter. Streettalk Advisors, LLC expressly disclaims all liability in ...
more

