
Technically Speaking: The Immediacy Trap

With Donald Trump’s official first day in office now behind us, the markets are now trying to rebalance between “campaign promises” and “governing realities.” Will withdrawal from the TransPacific Partnership be a good thing? Will a strong dollar due to a “Border Tax” be optimal? Will the repeal and replacement of the Affordable Care Act go smoothly?
Honestly, no one really knows and only time will tell.
But, one thing we do know is, as noted in this past weekend’s missive, the extreme bifurcation that occurred following the November election has begun to revert to the norm.
“The video below shows the historical “rotation” of sectors over the last 3-years. As you will notice sectors have consistently ‘swarmed’ in a clockwise rotation going from strongly outperforming the S&P 500 index to strongly underperforming. If you watch to the end of the video you will see the post-presidential election anomaly form.”
“I have notated on the Sector Rotation model below, the early stages of the reversion process of the extreme bifurcation between sectors below. Notice interest rate sensitive sectors and Financial’s are beginning to trade momentum.”

“This rotation is likely very early in its movement. As noted above, while RISK bullishness has reached extremes, SAFETY has been completely disregarded. Reversions tend to be rapid. “
(Click on image to enlarge)
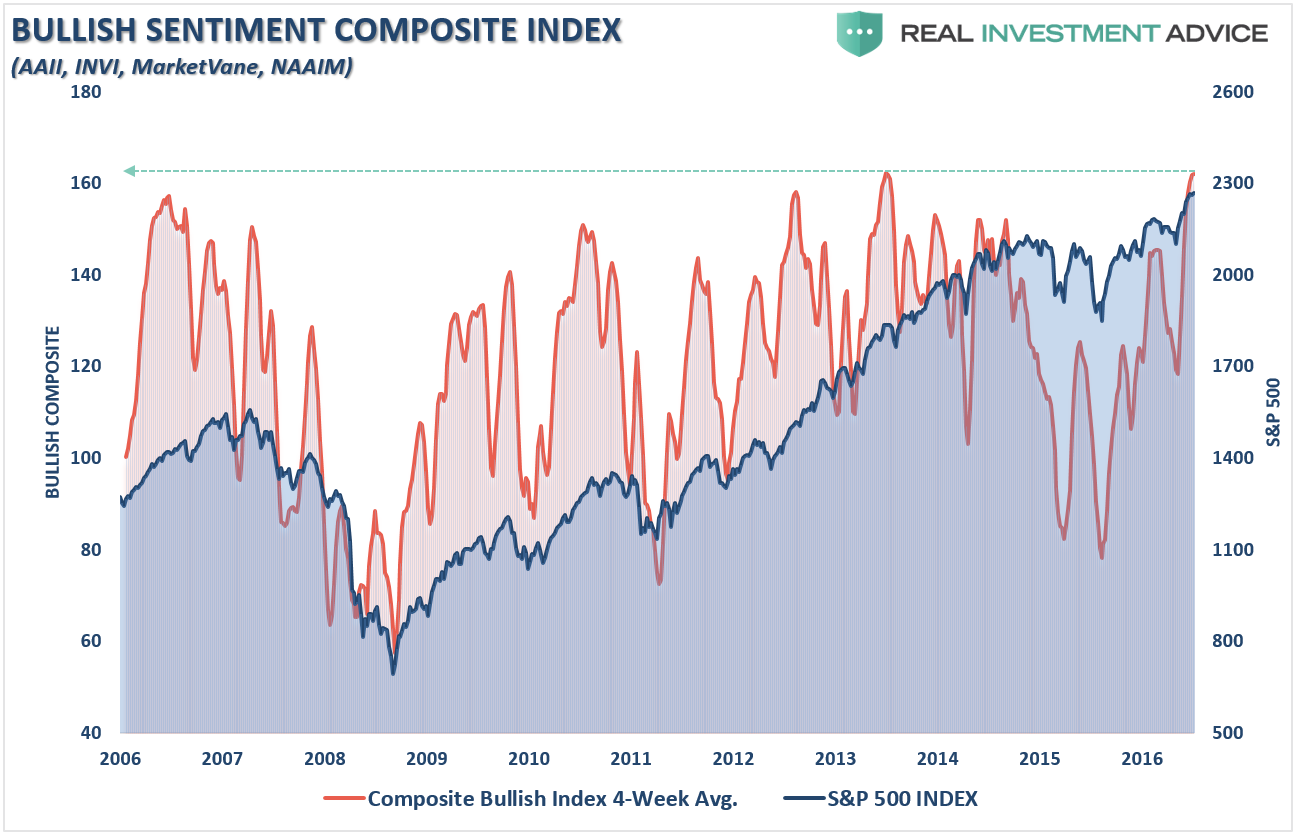
As I addressed two weeks ago, there are numerous extremes being registered in critical areas of the market that have historically led to rather nasty reversions from deviations, to interest rates and volatility. Most importantly, in the shorter-term, are the issues of deviation and complacency.
“I have often compared market prices to the equivalent of ‘stretching a rubber band.’ Prices can only deviate so far from the long-term trend line before a mean reverting event eventually takes place. Much like a ‘rubber band,’ prices can only be stretched so far before having to be relaxed to provide the ability to be stretched again.
The chart below shows the long-term trend in prices as compared to its underlying growth trend. The vertical dashed lines show the points where extreme overbought, extended conditions combined with extreme deviations in prices led to a mean-reverting event.”
(Click on image to enlarge)
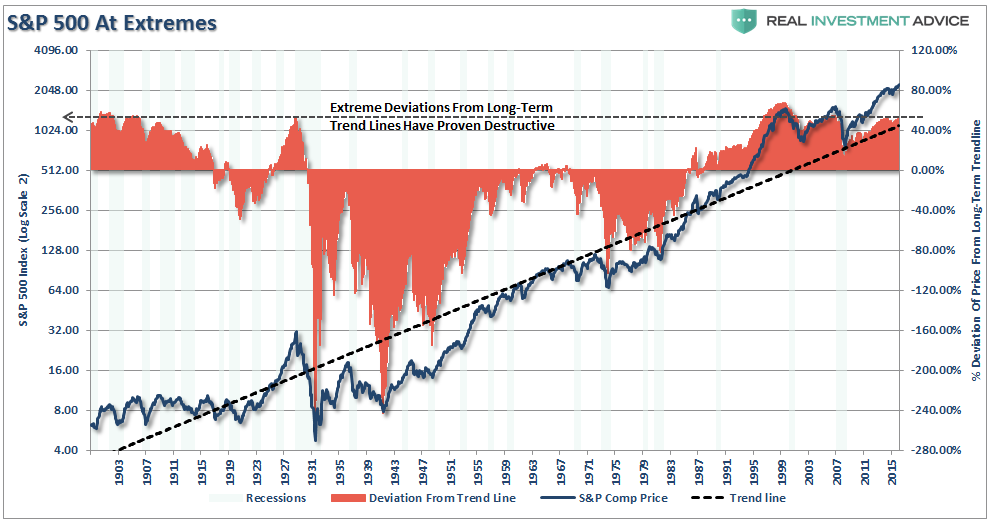
“Currently, while only slightly below the peak of the 2000 “dot.com” bubble, the deviation is at levels that have ALWAYS coincided with a negative mean reverting event or very poor, and highly volatile, forward returns.”
The following chart is a long, long-term look back to 1925 which shows the same. Large deviations from the long-term growth trend have historically not ended well…ever.
(Click on image to enlarge)
But that is the long-term view which could take months, quarters or even years to eventually develop.
Just like gambling, while everyone knows the “house always wins in the end,” the lure of the flashing lights and short-term gains are too enticing to pass up.
The Immediacy Trap
This brings me to today’s point.
When I was growing up my father told me more than once that “if you do that, son, you aren’t going to like the consequences.” Generally, those words were spoken to me just before I wanted to do something to fill an immediate desire – such as spending all my yard mowing money to buy my first car. It was cool, it looked fast and it was the first car I saw on the lot. Nothing else mattered – that car was mine and I have to have it right then and there. I was too young to know it then but I had fallen victim to the “immediacy trap.”
What my father was trying to tell me, and of course I didn’t listen, was what he already knew – the car was a total piece of crap.
I didn’t like the consequences.
Had I been patient, done my research, and shopped around for the right opportunity – I would have been much better off. Now, I will pass that experience down to my son – who, most likely, won’t listen to me either.That is the bond between father and son.
Experience has always been the best teacher if life, love, and money. Those that tend to disregard what experience has tried to teach them are often doomed to repeat the same mistakes over and over again. Yet, when it comes to economists, analysts and investors, past experience is something that is readily set aside when it disagrees with the overwhelming power of greed. For example, over the past couple of weeks, there have been numerous articles posted about how the recent rise in the market is indicative of an ongoing “bull market” despite the excessive extensions noted above.
What is generally wrong with the analysis is the context from which the assumptions are made. Despite the weight of evidence from the long-term perspective that investors will likely “lose the investing game” in the not so distant future, investors continue to shun economic and valuation realities to chase short-term gains.
This is investor psychology at work, which is why, as Howard Marks once quipped:
“Being right, but being early, is the same as being wrong.”
This is the “immediacy trap.”
The trap is assuming that just because valuation, deviation or price analysis has not led to an immediate mean reverting event – then “this time must be different.” In reality, what experience teaches us, is there is a lag effect between the weight of evidence and the eventual outcome.
Why? Because of human nature.
This is why, despite the extremely negative long-term setup, a focus on short-term price analysis can help to mitigate some of the equity-related risks in portfolios currently.
Yes, as a portfolio manager, I am long the markets currently and will remain so until the intermediate and longer-term trends turn negative. However, I also know the current run of this particular bull market cycle is nearing completion and, as with all markets, I want to avoid as much of the second half of the full-market cycle as possible.
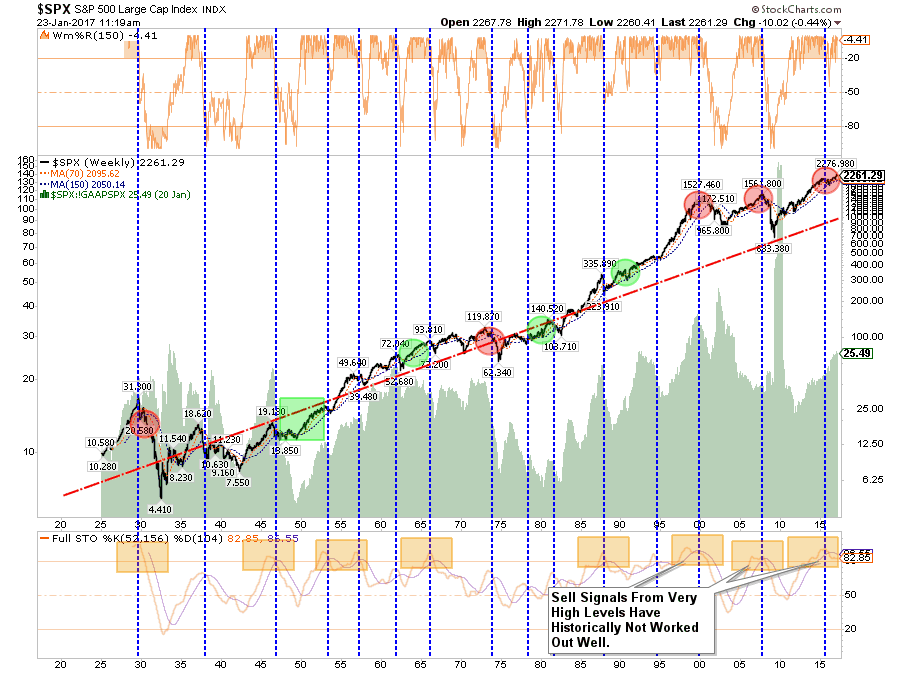
(Click on image to enlarge)
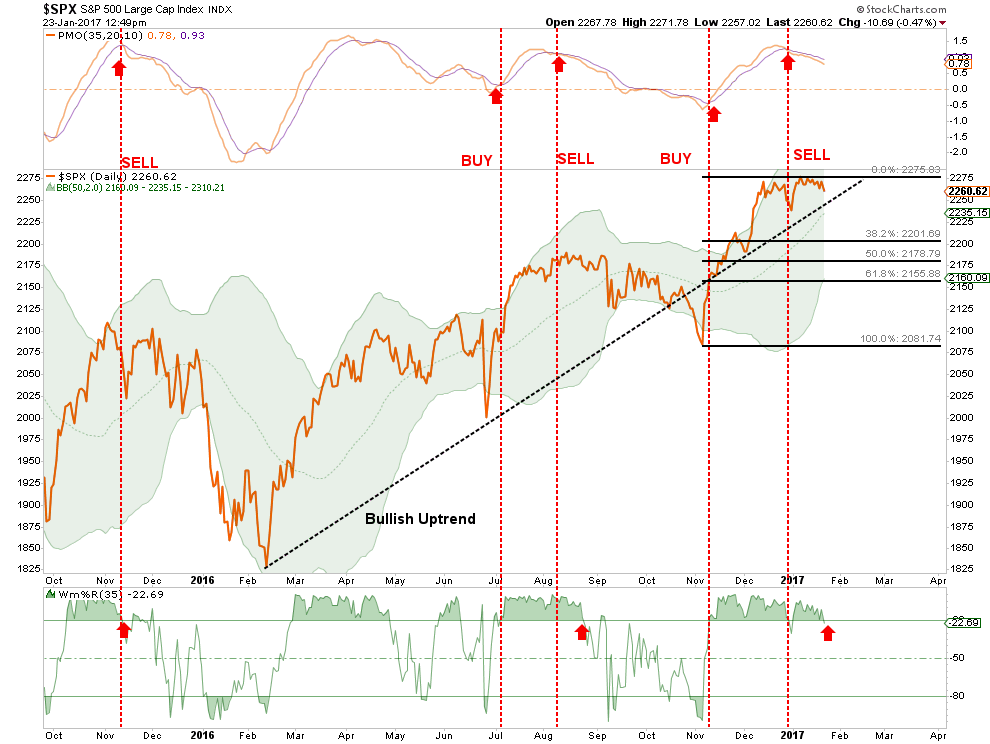
The chart above shows the recent advance of the market has gotten to extremely overbought conditions on a short-term basis and the “sell signal” noted at the top of the chart, combined with the extreme overbought condition at the bottom, suggest a potential correction could take the market back to 2200. While such a correction would be relatively minor in the short-term, it would also violate the bullish uptrend that has held since the 2016 lows.
However, putting this into an actual loss perspective, the following chart details specific support levels back to the psychological level of 2000. A violation of the 2000 level and we are going to start discussing the potential for a more severe market correction.
(Click on image to enlarge)
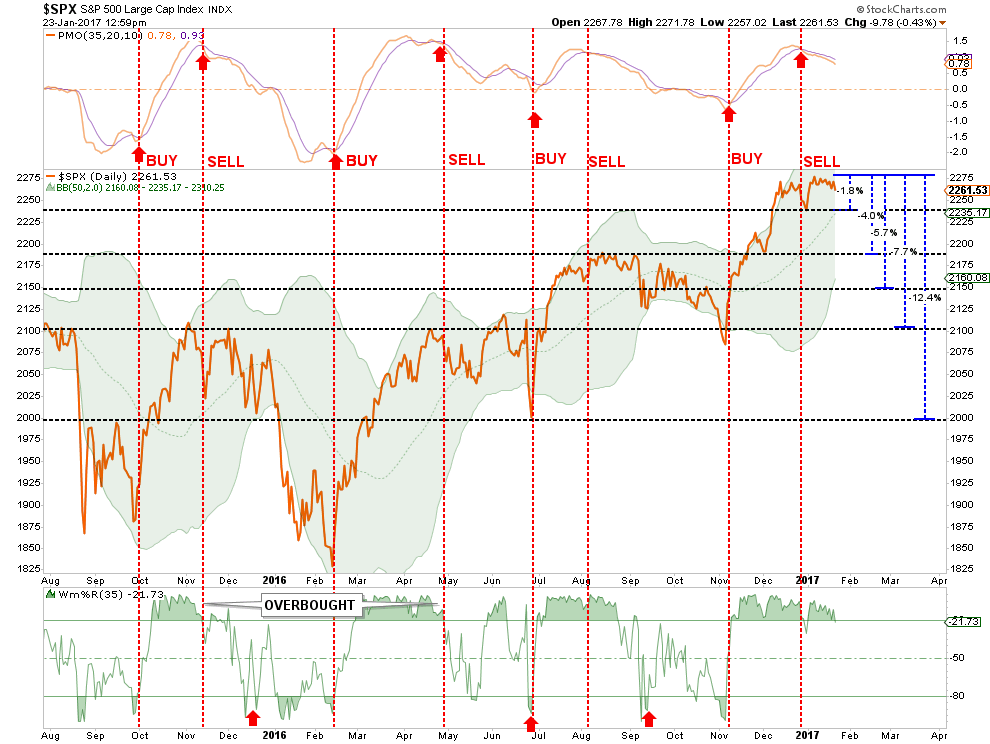
The current correction from the previous highs is already underway and initial support should theoretically hold at 2235. This would entail a loss of 1.9% from the peak. (I know…it would be devastating.)
A violation of that initial support level sets up corrections of 4.0%, 5.7%, 7.7% and 12.4% from the recent highs. With bullishness running at highs, and cash allocations at lows, the risk of a short-term reversal is high.
However, I am certainly not discounting the short-term ability for the markets to move higher as discussed in “2400 or Bust!.” This is particularly the case if fiscal policy is actually implemented, earnings improve more than expected or additional monetary policy is introduced. But it is the risk of loss that currently outweighs the reward. Adam Butler, Mike Philbrick, and Rodrigo Gordillo penned back an interesting note back in 2013 with respect to the importance of loss.
“Portfolio growth is governed by the mathematics of compounding, which means that, for example, a 100% gain is erased by a 50% loss, and a 50% loss requires a 100% gain to get back to even. Applying the same principles to where we are in the current bull/bear cycle is illuminating.
If we assume that the next bear market will deliver losses in-line with what we have experienced from bear markets through history, then at the bottom of the next bear market investors will have lost 38% of their portfolio value. The question is, how much must current investors expect stocks to gain before peaking to justify owning them here instead of waiting to purchase them in the next bear market?
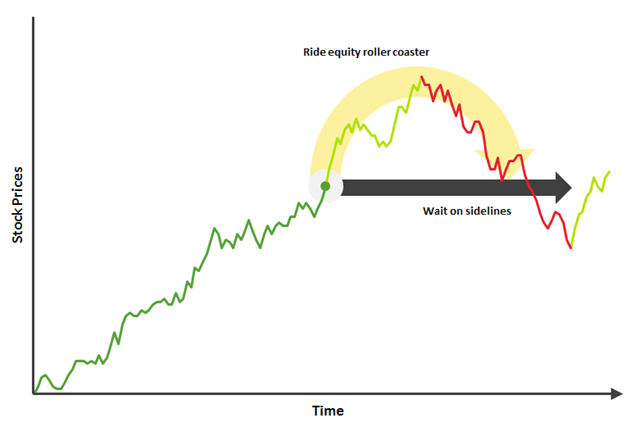
The most unbiased estimate of the magnitude of the next bear market is the historical median of 38%. Using the math of compounding, we can determine that a 38% loss requires a 61% gain to break-even [1 / (1 – 38%)]. Logically then, and by extension, investors who choose to hold stocks today must expect gains of at least 61% in order to rationalize their investment; otherwise they would eliminate the anxiety of riding the equity roller-coaster and simply invest in cash, waiting to pounce on stocks at equivalent or lower value at some point during the next bear market.”
In the near term, over the next several months or even the next year, markets could very likely continue their bullish trend as long as nothing upsets the balance of investor confidence and market liquidity.
However, of that, there is no guarantee.
As Ben Graham stated back in 1959:
“‘The more it changes, the more it’s the same thing.’ I have always thought this motto applied to the stock market better than anywhere else. Now the really important part of the proverb is the phrase, ‘the more it changes.’
The economic world has changed radically and will change even more. Most people think now that the essential nature of the stock market has been undergoing a corresponding change. But if my cliché is sound,then the stock market will continue to be essentially what it always was in the past, a place where a big bull market is inevitably followed by a big bear market.
In other words, a place where today’s free lunches are paid for doubly tomorrow. In the light of recent experience, I think the present level of the stock market is an extremely dangerous one.”
He is right, of course, things are little different now than they were then. The only question will be what eventually tips over the “apple cart.”
Disclosure: The information contained in this article should not be construed as financial or investment advice on any subject matter. Streettalk Advisors, LLC expressly disclaims all liability in ...
more


thanks for sharing