
Technically Speaking: Still Not Out Of The Woods

In this past weekend’s newsletter, I discussed the markets walk along a bullish trend line:
“With the Fed holding still on hiking rates, with a promise to now hike in December(**cough****bullshit****cough), traders came rushing back into the market pushing prices right back into the trading range of the last month.
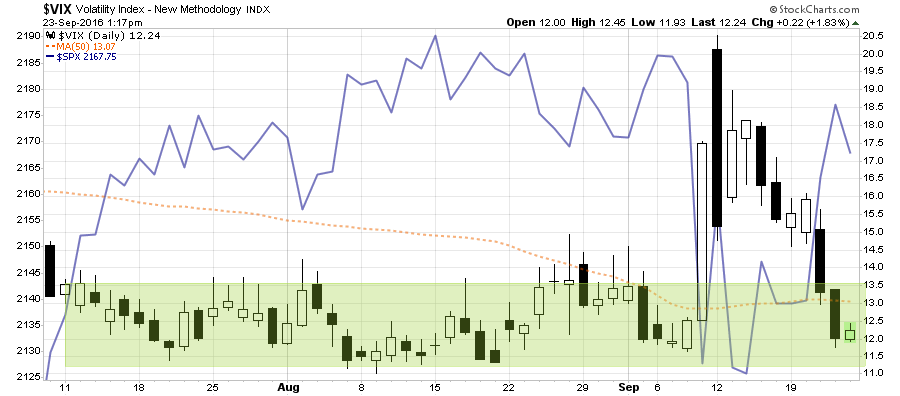
Consequently, the volatility index was also smashed back to its recent lows as “fear” has been completed eliminated for now.
Basically, if you strip out the past week of volatility, nothing really changed.”
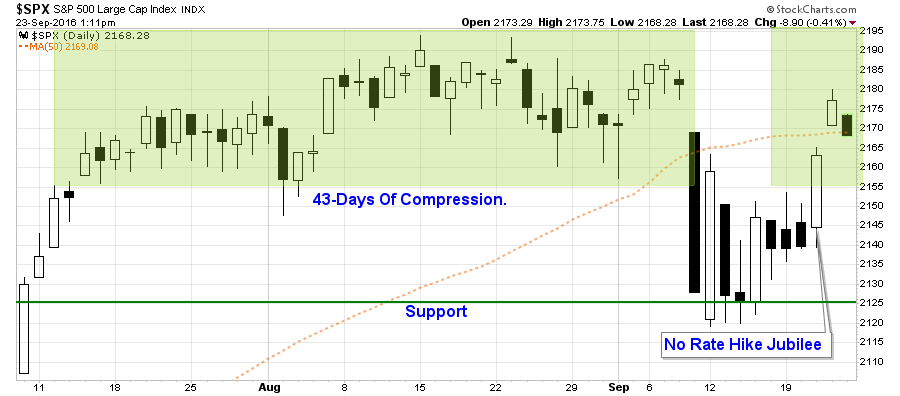
The problem is that while nothing really changed in the past week, it also means that we are STILL not “out of the woods” yet to allow the bulls to claim victory.
Let’s review some charts.
The first chart below is a weekly chart of the S&P 500. This is the good news.
Despite a rather volatile last couple of weeks, the market maintained support at the intermediate term moving average and remained above the bullish trend line from the February lows. Importantly, the pullback and subsequent rally confirmed the bullish breakout above the previous highs from last year.
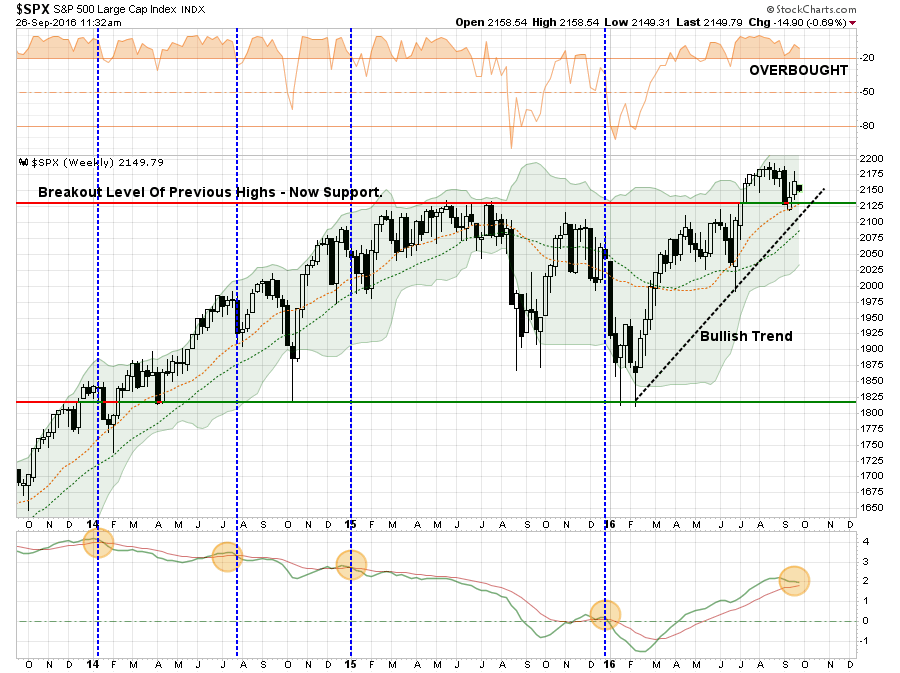
The bad news is the market is dangerously close to issuing an intermediate term sell-signal. This does not mean the markets are about to have a major crash, but historically, these signals have generally coincided with at least short-term market peaks.
If we move to a shorter-term analysis of the market using daily data, a little different picture emerges. As shown below the bullish trend AND the retest of previous “breakout levels” remain as above.
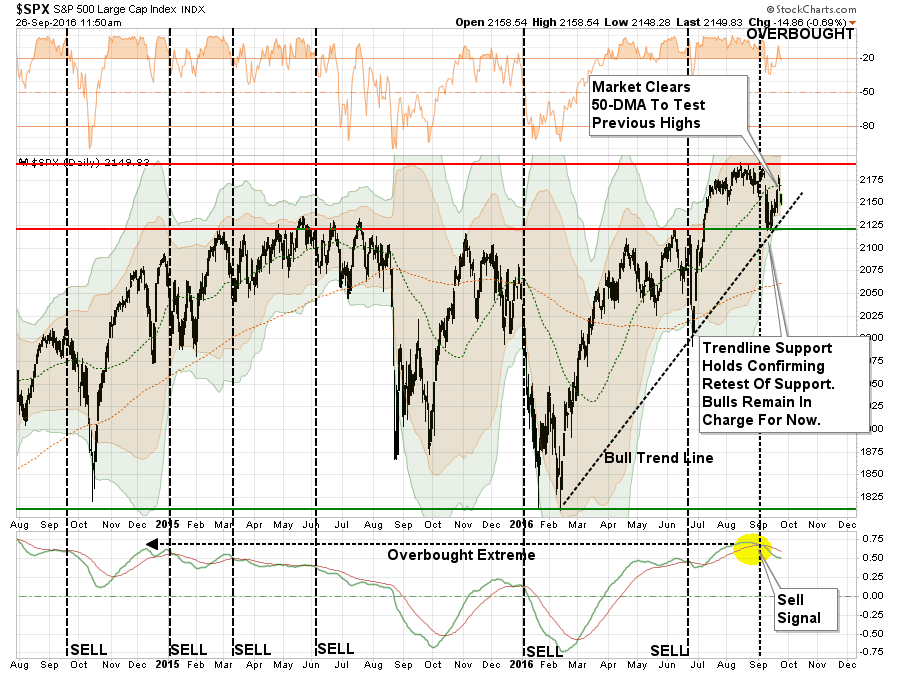
However, due to the shorter-term nature of the price movements, sell signals have occurred more frequently in this analysis. Currently, the market continues to struggle under an “active sell signal” and the bullish trend support is not far below. If the market fails support of that trend-line expect a bigger correction to ensue.
Combined with current overbought conditions that still need to be resolved, the investment risk remains to the downside currently. This is also confirmed by the next chart below.
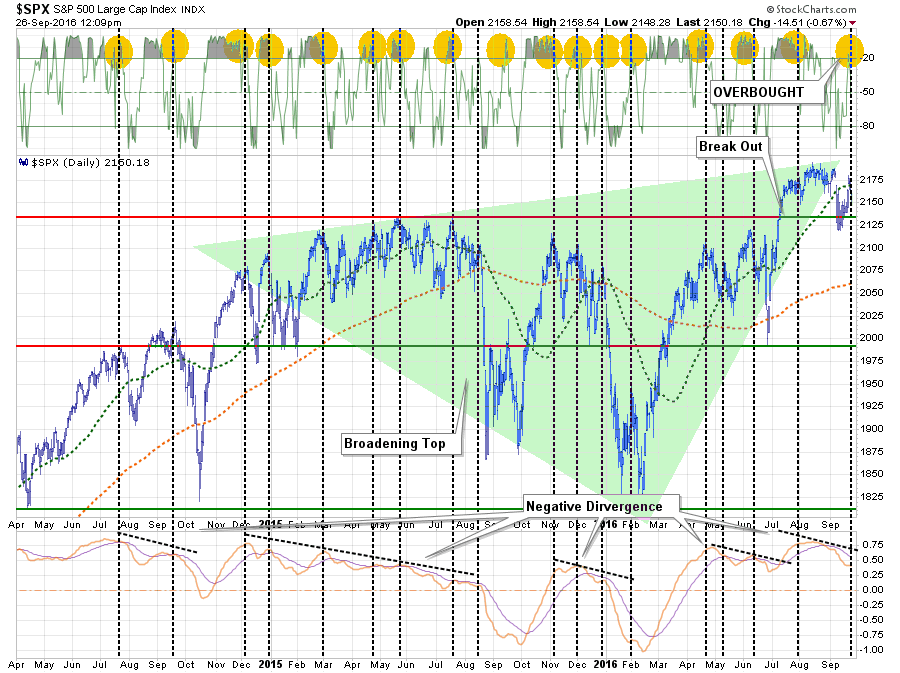
The markets remain confined within what currently appears to be a broadening topping pattern, or megaphone, which historically suggest a much bigger correction may be in the works. As with the chart above, the overbought condition of the market, combined with active sell signals, suggests the environment for more aggressive equity exposure is not currently present.
For now, we wait until the market resolves this current process by either breaking out to new highs confirming the bullish trend – OR – breaking the bullish trend line and beginning a larger correction process. Guessing at what happens next tends to not work out well for investors historically.
If we step back from the short-term price action for a moment, the economic data continues to suggest the “profits recovery” story in the second half of the year may be disappointing.
The Most Important Economic Number
While economic numbers like GDP or the monthly non-farm payroll report typically garner the headlines, one of the most useful economic measures is the Chicago Fed National Activity Index (CFNAI). The index is a composite index made up of 85 subcomponents which gives a broad overview of overall economic activity in the U.S. Unfortunately, the media gives it little attention.
The overall index is broken down into four major sub-categories which cover:
- Production & Income
- Employment, Unemployment & Hours
- Personal Consumption & Housing
- Sales, Orders & Inventories
To get a better grasp of these four major sub-components I have constructed a 4-panel chart showing each.

There are a couple of important points to be made in reference to the chart above.
- The production, employment, and sales components all appear to have peaked for the current economic cycle despite ongoing estimations of stronger economic growth in the last half of 2016. Of course, this has been the case every year since 2011 which has yet to manifest itself.
- The consumption and housing component, while it has gotten stronger, remains well below its 2000 levels.
The CFNAI, while volatile, has a very strong historical correlation to economic growth rates due to its broad makeup. I have created a second 4-panel chart below with the CFNAI subcomponents compared to the four most comparable economic reports of Industrial Production, Employment, Housing Starts and Personal Consumption Expenditures. In order to get a comparative base to the construction of the CFNAI, I used an annual percentage change for these four components.
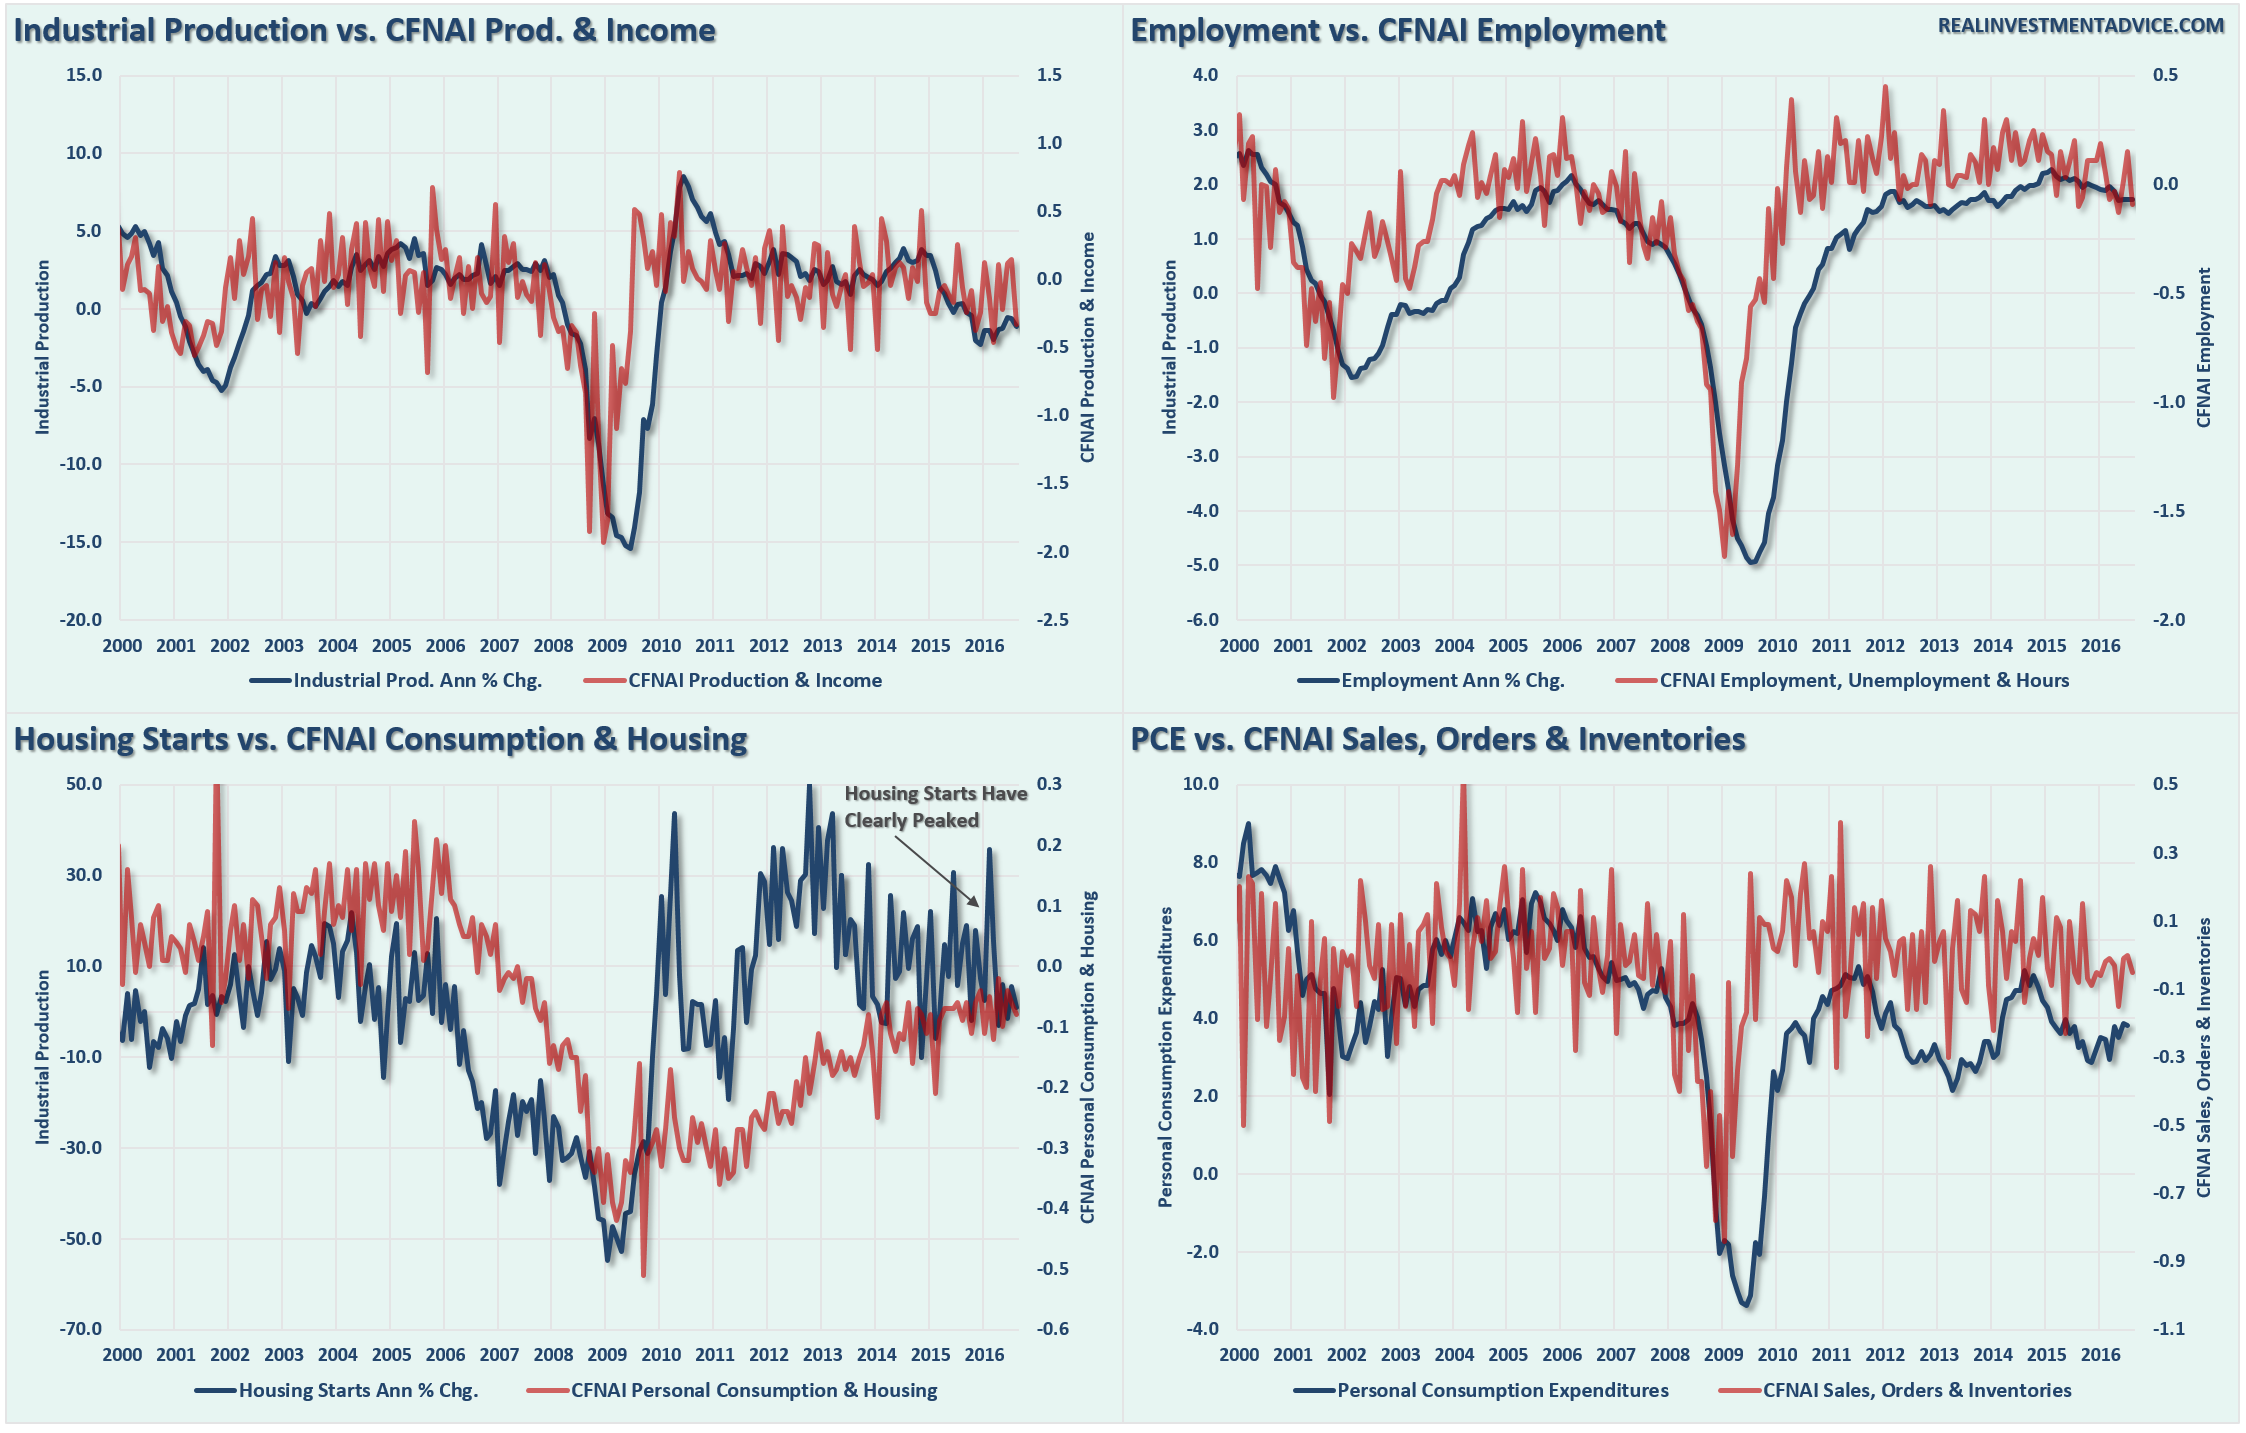
The CFNAI subcomponents and the underlying major economic reports do show some very high correlations. This is why, even though this indicator gets very little attention, it is very representative of the broader economy.
Currently, the CFNAI is not confirming the mainstream view of stronger “economy” headed into year-end, but rather one that may well be closer to the brink of recession. The chart below shows the diffusion index of the CFNAI index as compared to the S&P 500. Since the markets are reflective of the economy, the diffusion index shows the trend of the 85 subcomponents of the index. As shown, each time the diffusion index has reached current levels previously, the outcome for the economy and the markets was not so good.
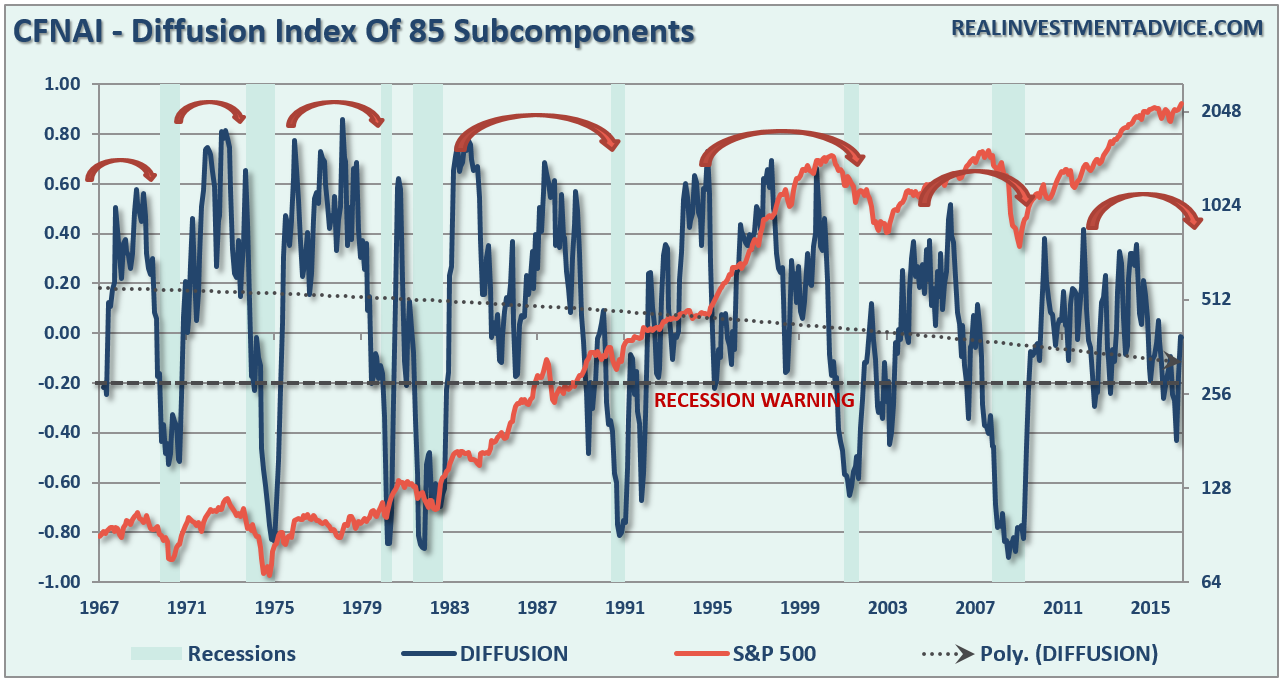
The data continues to support the ongoing premise of weaker than anticipated economic growth despite the Central Bank’s ongoing liquidity operations. The current trend of the various economic data points on a broad scale is not showing indications of stronger economic growth, but rather a continuation of a sub-par “muddle through” scenario of the last five years.
While this is not the end of the world, economically speaking, such weak levels of economic growth do not support stronger employment, higher wages or justify the markets valuations. The weaker level of economic growth will continue to weigh on corporate earnings which, like the economic data, appear to have reached their peak for this current recovery cycle.
As first stated above, the short-term outlook remains bullishly constructive for the moment as long as the market can maintain the bullish trend line from the February lows. However, on a longer-term basis, the economic and fundamental data is having a much more difficult time trying to support current price and valuation levels. As shown in the chart below of quarterly data, the market is currently at levels that have historically ALWAYS been associated with a major peak.
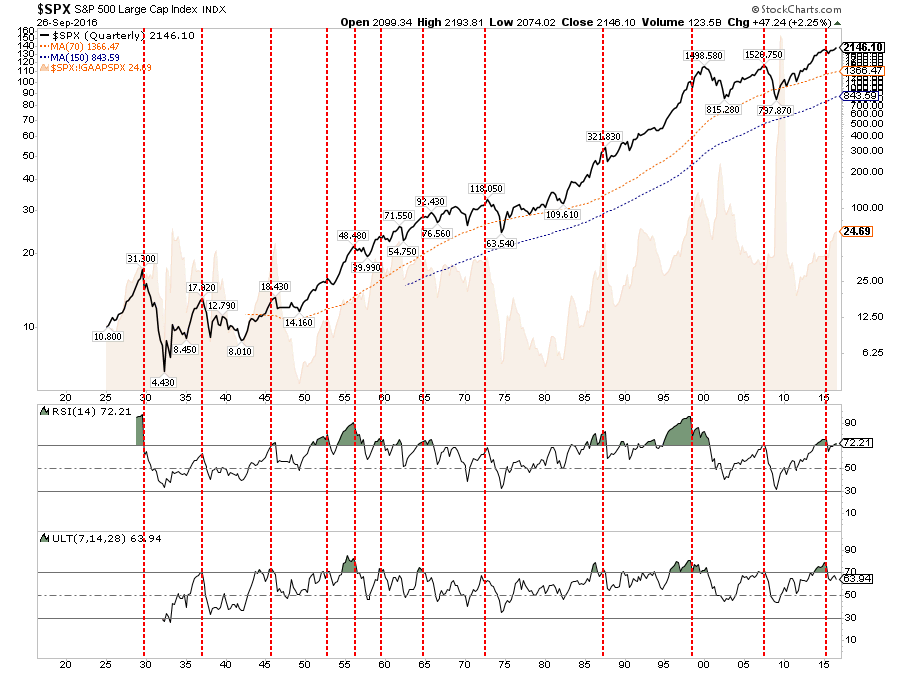
The economic data must take a sharp turn for the positive in the weeks ahead or prices are going to have a difficult time advancing through the end of the year. More importantly, if the CFNAI is correct, the expected hockey stick recovery of earnings into year end may come with the bitter taste of disappointment.
Do you really want to be this time is different?
Disclosure: The information contained in this article should not be construed as financial or investment advice on any subject matter. Streettalk Advisors, LLC expressly disclaims all liability in ...
more

