
Technically Speaking: Riddle Me This
In this past weekend’s newsletter, I discussed my remembrances of the Riddler in the original Batman series and how he would pose riddles to the dynamic duo as they faced the certain demise. In that vein, I posed the following question:
“IF investment success is achieved by ‘buying when others are fearful and selling when others are greedy,’ then what should you be doing now?”
This is the most difficult question for investors who are caught up in the “Greed/Fear Cycle.” As I noted yesterday, this is a key point made by the legendary Howard Marks:
“It’s the swings of psychology that get people into the biggest trouble, especially since investors’ emotions invariably swing in the wrong direction at the wrong time. When things are going well people become greedy and enthusiastic, and when times are troubled, people become fearful and reticent. That’s just the wrong thing to do. It’s important to control fear and greed.
We need to remember to buy more when attitudes toward the market are cool and less when they’re heated. Too little skepticism and too much eagerness in an up-market – just like too much resistance and pessimism in a down-market – can be very bad for investment results.
Warren Buffett once said,
‘The less prudence with which others conduct their affairs, the greater the prudence with which we must conduct our own affairs.’
The fundamental building block of investment theory is the assumption that investors are risk averse. But, in reality, they are sometimes very risk averse and miss a lot of buying opportunities, and sometimes very risk tolerant and buy when they shouldn’t. Risk aversion isn’t constant or dependable. That’s what Buffett means when he says that when other people apply less, you should apply more.”
This is the subject of today’s chart review, but first a quick bit of history.
In 2013, I posted an article discussing the ability of the market to be driven higher (to 2300) by Bernanke/Yellen’s continued injections of liquidity through QE programs. To wit:
“That’s right, despite all of the recent ‘bubble talk,’ it is entirely possible that stocks could rise 30% higher from here. However, it is not because valuations are cheap because as I discussed in my recent analysis of Q3 earnings stocks are trading near 19x trailing earnings.
The use of forward, operating estimates, is only beneficial to Wall Street analysts who need to create a ‘valuation’ story when none really exists. Overly optimistic assumptions about the future spurs faulty analysis in the present as sliding earnings leads to sharp valuation increases.”
Then last year, I penned “2400 or Bust!” stating:
“The reality is that a breakout and advance to 2400 is actually quite possible given the confluence of Central Bank actions, increased leverage, and the embedded belief ‘There Is No Alternative (TINA).’ It would be quite naive to suggest otherwise.
Given the technical dynamics of the market going back to the 1920’s, it would be equally naive to suggest that ‘This Time Is Different (TTID)’ and this bull market has entered a new ‘bull phase.’”
While the Fed has stopped expanding its balance sheet, investor sentiment has finally kicked into drive asset prices higher. This is what the famed Richard Russell described as the “mania phase:”
‘The third or speculative phase of a bull market is characterized by a wild and wooly and ever-increasing entrance by the retail public. This phase is characterized by hot tips, hype, and pure greed.’“
I point out this previous remarks because I am often considered to be a “perma-bear” simply because I point out the risks posed to investor capital versus the “hope” that prices continue to rise. This point was made clear in a Twitter discussion this weekend:
@CryptoCryptics No such thing as "upside risk." RISK is the penalty of making a wrong decision. RISK = LOSS not MISSED OPPORTUNITY.
— Lance Roberts (@LanceRoberts) February 12, 2017
@CryptoCryptics how about let's call it what it is "RATIONALIZATION"
— Lance Roberts (@LanceRoberts) February 12, 2017
Whether it is Howard Marks, Richard Russell, or even Warren Buffett, the time to invest in the markets is when others are fearful. The time to sell is when everyone else is greedy.
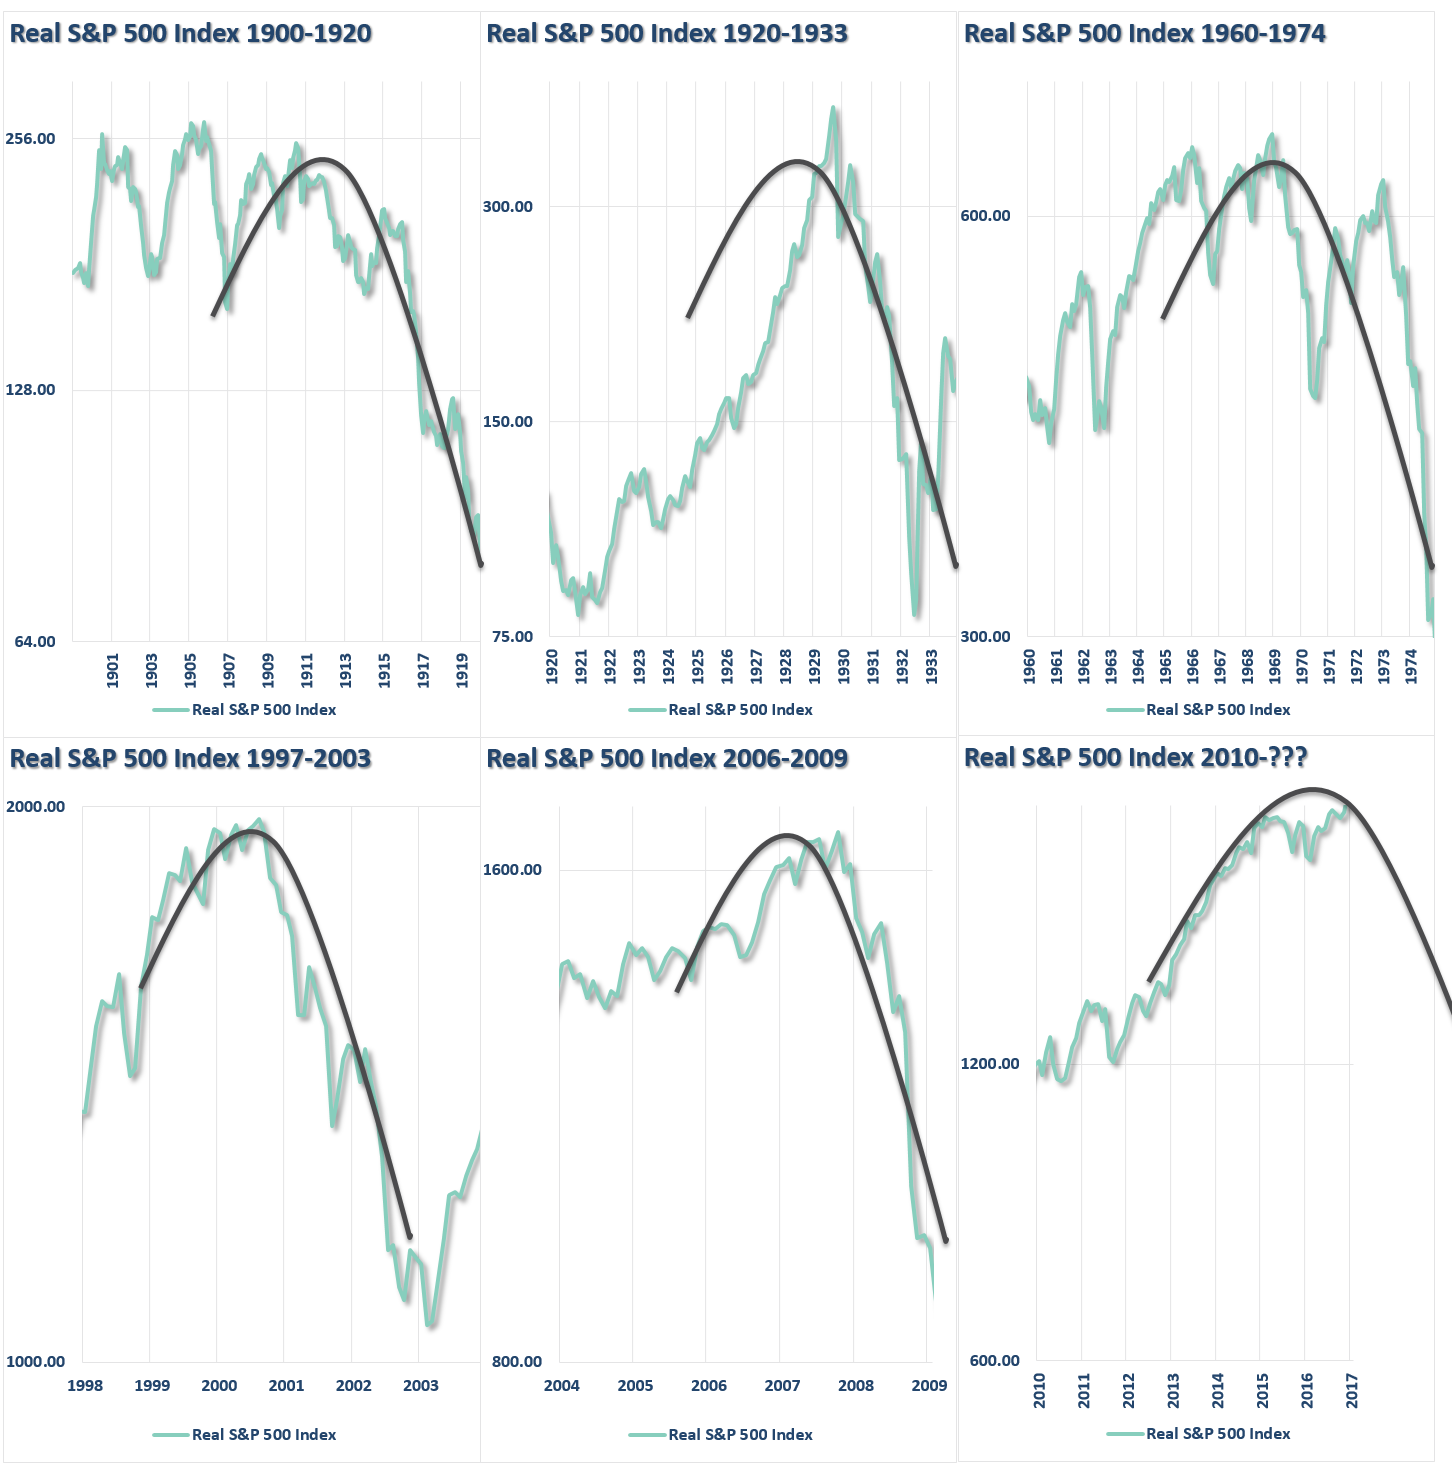
I have accumulated the following series of charts to let you decide your own personal level of skepticism and eagerness as markets hit all-time highs.
Fundamental Views
With markets hitting all-time highs, it is not surprising that valuations are pushing the second highest level in history as well.

Not surprisingly, when valuations are above 20x earnings, forward 10-year returns have declined.

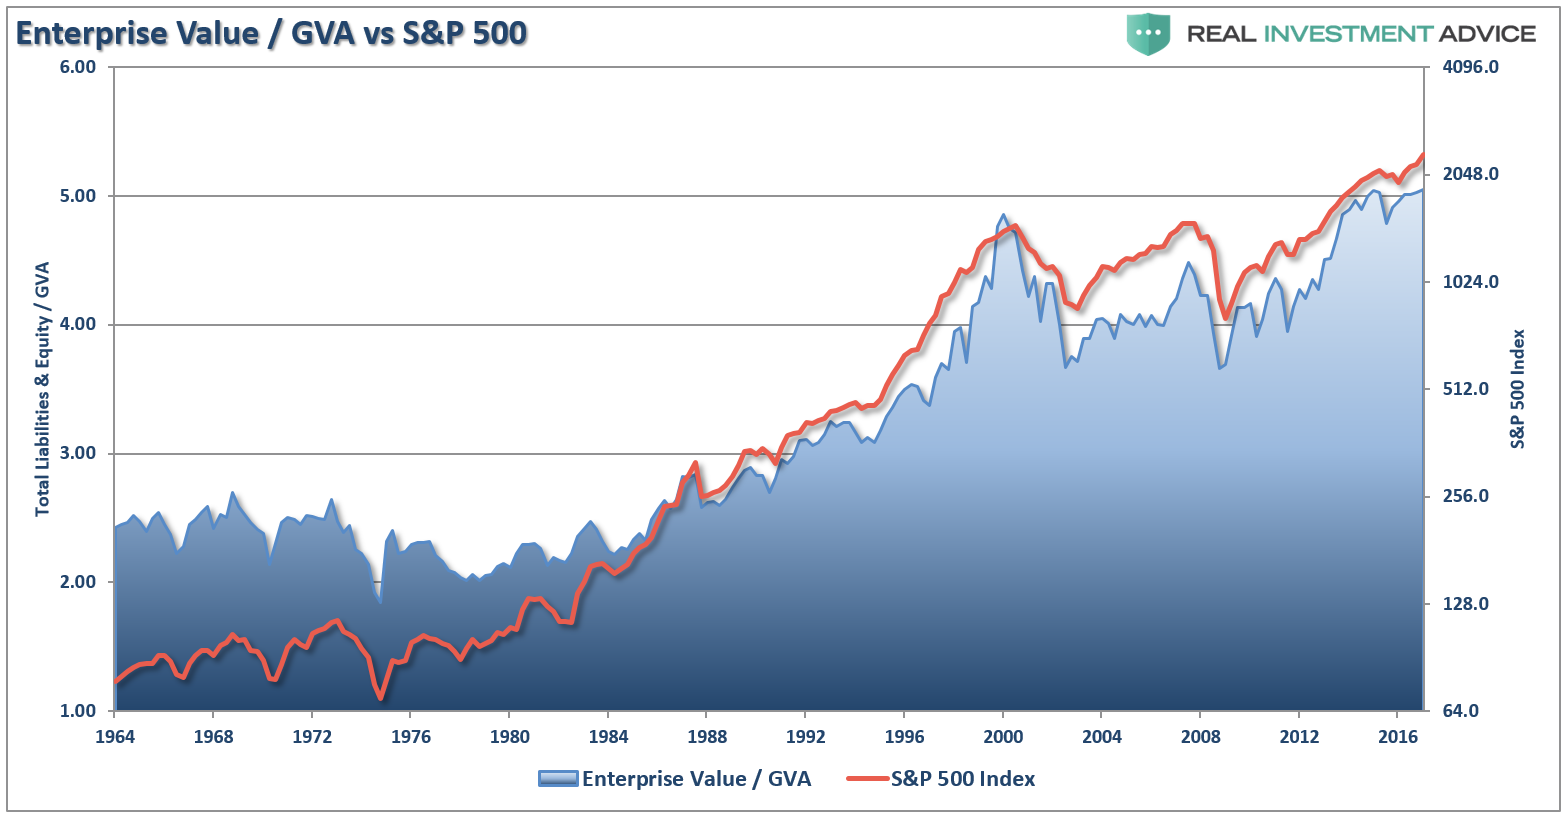
This is also shown in the record levels of Enterprise Value / Gross Value Added (GVA).
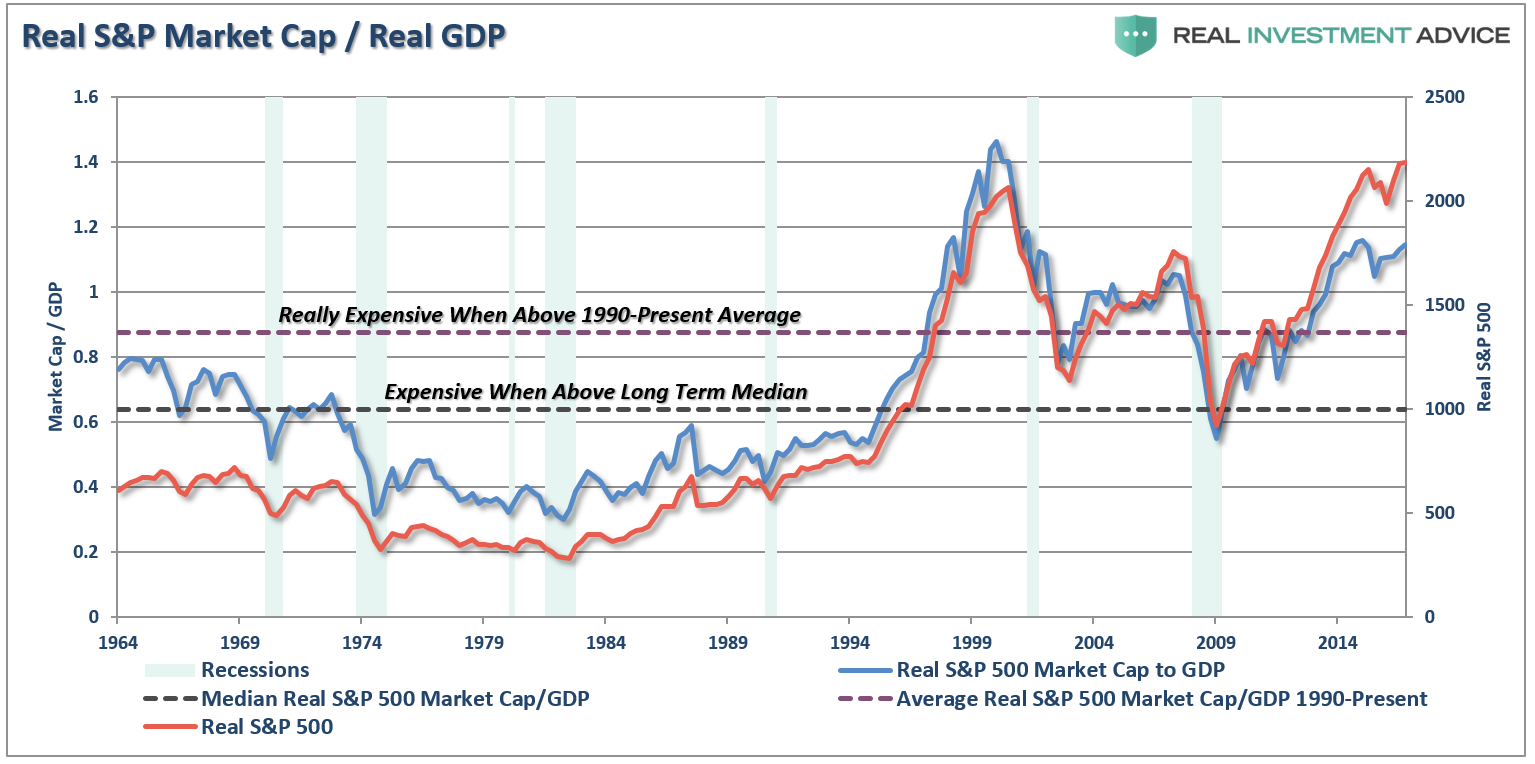
On an inflation-adjusted basis, the market capitalization rate of the S&P 500 as a percentage of GDP is now at the second highest level on record.
Which, not surprisingly, given the record amount of financial engineering being used to boost bottom line earnings, is weighing on corporate return on equity.

However, given the complete disregard for fundamentals, which has been typical near major bull market peaks, let’s take a look at some of the technical views.
Then there is Ed Yardeni’s “Boom Bust” indicator as discussed this past weekend:
“The Boom-Bust Barometer (made famous by Dr. Ed Yardeni) is a simple, but effective, way of avoiding large drawdowns in the stock market. As you can see in the charts below, the indicator is currently making all-time highs.”

Technical Views
The 6-year rate of change in the inflation-adjusted S&P 500 index is now falling back towards zero. It is the decline in the rate of return of the index that has preceded major market reversions. (The reversions are where the negative ROC occurs.)

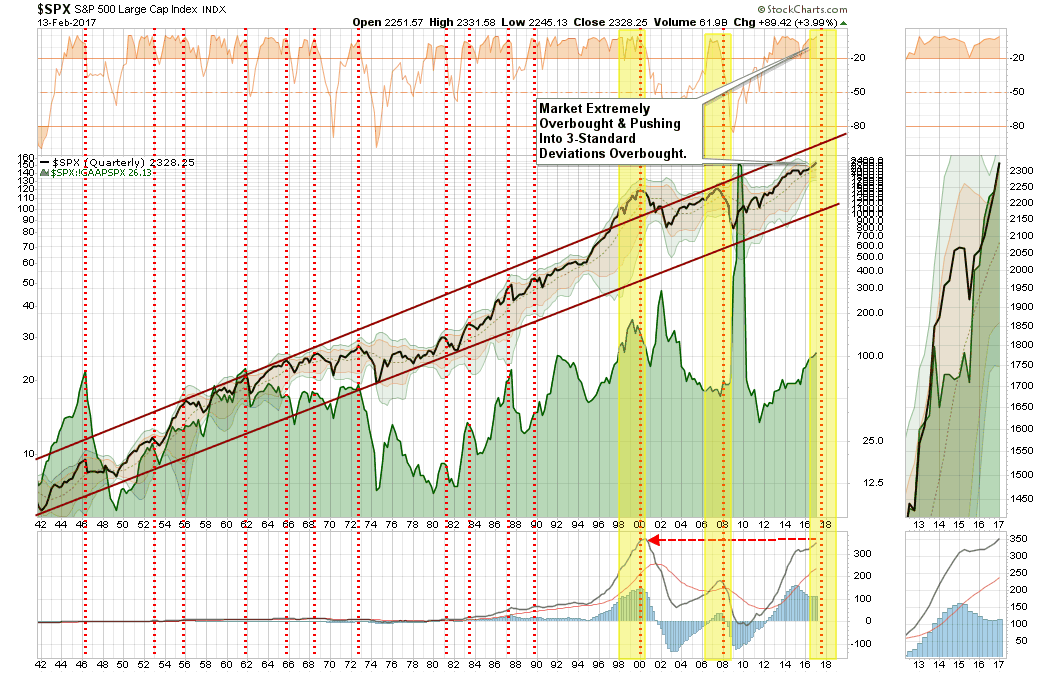
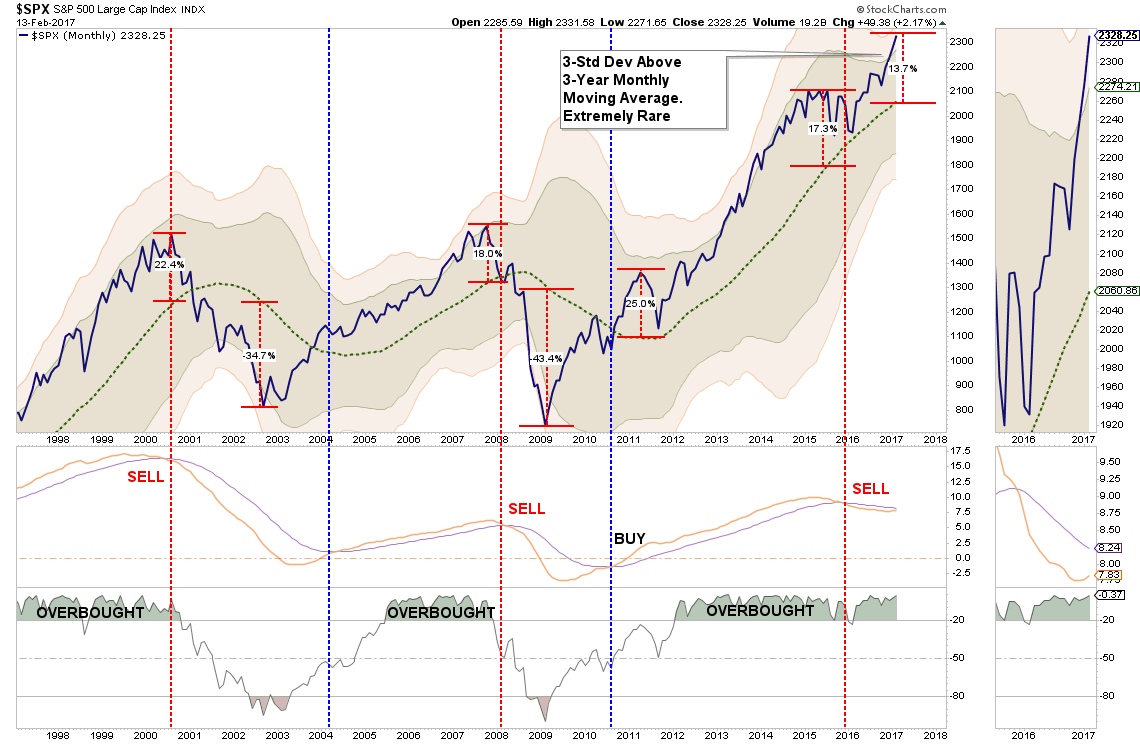
As I have discussed previously, market prices are like a rubber-band that can only be stretched so far before they ultimately “snap back.” At 3-standard deviations (roughly 99% of historical price movement), which is a very rare occurrence, the price of the market has risen to levels that have historically denoted peaks rather than beginnings.
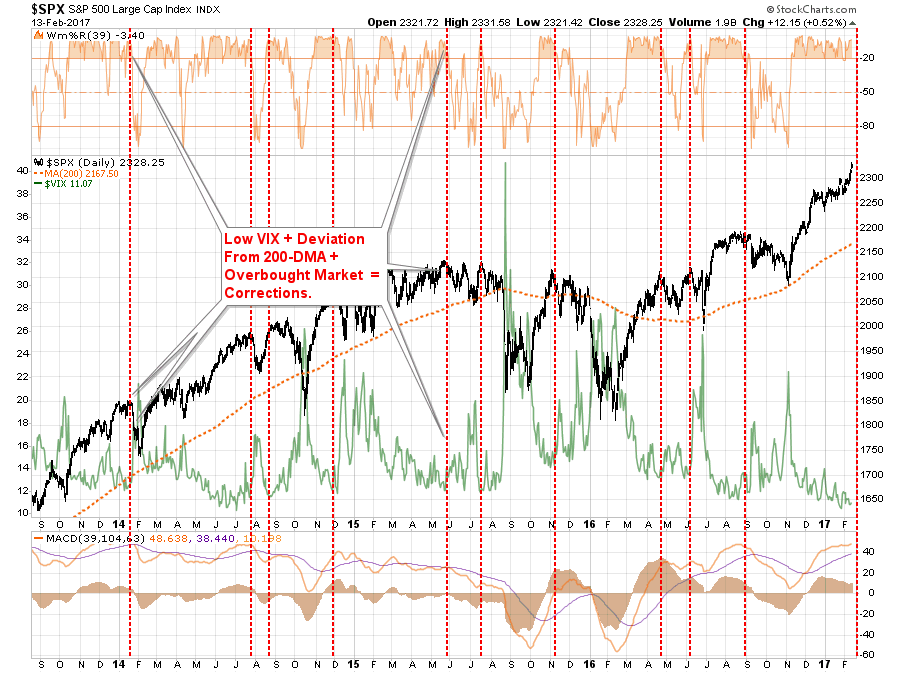
One of the big concerns as of late is the extremely high level of “complacency” in the market currently. An extremely complacent market, combined with extreme overbought conditions, should elicit some concern about excessive market risk currently.
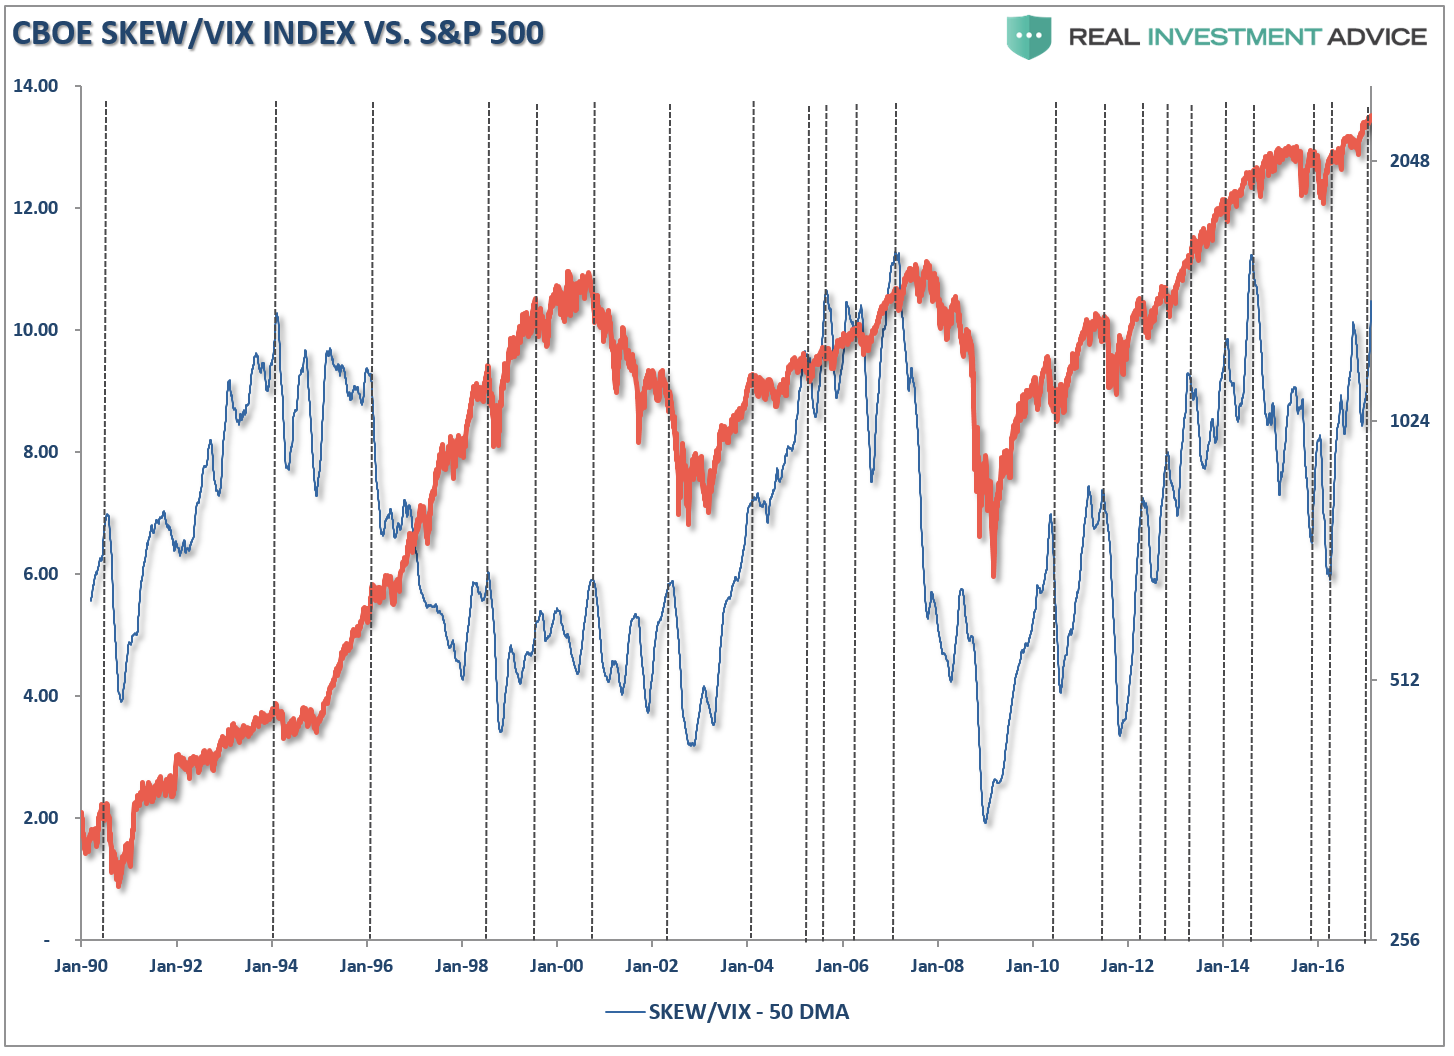
The ratio of the CBOE Skew/VIX index also suggests that investors should have a higher level of caution than normal. Look for the indicator to turn down and begin to deteriorate as an early warning indicator of a market correction.
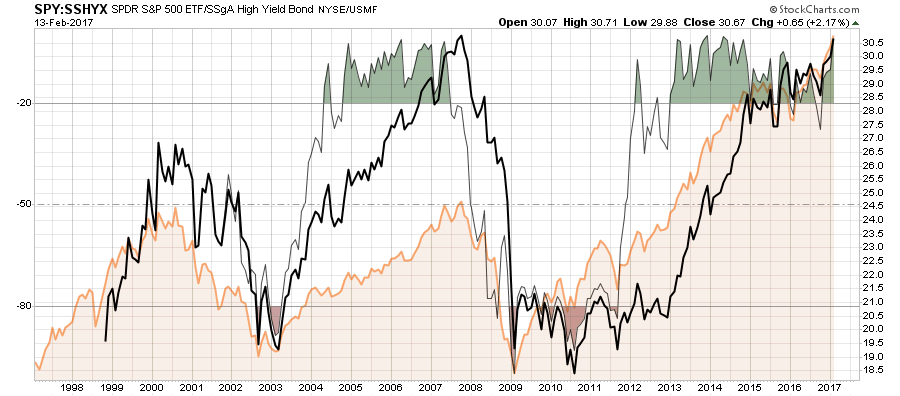
Of course, the extremely low level of “fear” in the market currently has led to a maddening chase for “junk bonds” in the market. As shown below, the S&P 500/High Yield Bond ratio is pushing its highest level on record. This will end badly for those who unwittingly undertake the risk believing “high yield bonds” are a “safe alternative” to stocks. They aren’t.
Lastly, the deviation of the market from its 3-year moving average, combined with a 3-standard deviation push above the 3-year average and a concurrent “sell signal,” should be some type of warning.
On a very short-term basis, the current uptrend is tightening into a very tight wedge. A break to the downside of this wedge, the most likely probability, should lead to an initial retest of 2200ish. A break below that level will likely lead to a retest of 2075.

Answering The Riddle
Some time ago I wrote a discussion on “Asymmetrical Bubbles” and George Soros’ theory of reflexivity.
“I have developed a rudimentary theory of bubbles along these lines. Every bubble has two components: an underlying trend that prevails in reality and a misconception relating to that trend. When a positive feedback develops between the trend and the misconception, a boom-bust process is set in motion. The process is liable to be tested by negative feedback along the way, and if it is strong enough to survive these tests, both the trend and the misconception will be reinforced. Eventually, market expectations become so far removed from reality that people are forced to recognize that a misconception is involved. A twilight period ensues during which doubts grow and more and more people lose faith, but the prevailing trend is sustained by inertia. As Chuck Prince, former head of Citigroup, said, ‘As long as the music is playing, you’ve got to get up and dance. We are still dancing.’ Eventually, a tipping point is reached when the trend is reversed; it then becomes self-reinforcing in the opposite direction.
Typically bubbles have an asymmetric shape. The boom is long and slow to start. It accelerates gradually until it flattens out again during the twilight period. The bust is short and steep because it involves the forced liquidation of unsound positions.”
There is currently much debate about the health of financial markets. Have we indeed found the “Goldilocks economy?” Can prices can remain detached from the fundamental underpinnings long enough for an economy/earnings slowdown to catch back up with investor expectations?
The speculative appetite for “yield,” which has been fostered by the Fed’s ongoing interventions and suppressed interest rates, remains a powerful force in the short term. Furthermore, investors have now been successfully “trained” by the markets to “stay invested” for “fear of missing out.”
The increase in speculative risks, combined with excess leverage, leave the markets vulnerable to a sizable correction at some point in the future. The only missing ingredient for such a correction currently is simply a catalyst to put “fear” into an overly complacent marketplace.
In the long term, it will ultimately be the fundamentals that drive the markets. It is all reminiscent of the market peak of 1929 when Dr. Irving Fisher uttered his now famous words: “Stocks have now reached a permanently high plateau.” The clamoring of voices proclaiming the bull market still has plenty of room to run is telling much the same story. History is replete with market crashes that occurred just as the mainstream belief made heretics out of anyone who dared to contradict the bullish bias.
It is critically important to remain as theoretically sound as possible. The problem for most investors is their portfolios are based on a foundation of false ideologies which is only discovered when reality collides with them.
So, Batman, if our job is to “Sell High” so we can “Buy Low” – then what are you doing now?
Riddle me that.
Disclosure: The information contained in this article should not be construed as financial or investment advice on any subject matter. Streettalk Advisors, LLC expressly disclaims all liability in ...
more

