
Technically Speaking: Psychology Of Loss
In this past weekend’s newsletter, I discussed the formation of a very important “head and shoulders” topping pattern in the market.
I know…I know. As soon as I wrote that I could almost hear the cries of the “perma-bull” crowd exclaiming “how many times have we heard that before.”
They would be right. The problem with the majority of technical analysis, in my opinion, is that time frames are too short for most investors. When looking at technical price patterns using daily data, there have been numerous occasions where analysts have spotted “Head and Shoulder” patterns, “Hindenberg Omens,” and “Puppy Monkey Baby“ patterns that have failed to predict a market downturn.
Of course, like “crying wolf,” when these patterns and prognostications fail they are summarily dismissed as being wrong, or just “mumbo jumbo.” As I stated above, the problem is the “duration mismatch” between most technical analysis, which is typically very short-term (minute, hourly, daily), and the outlook for investors which is in years.
As a portfolio manager, what is important for me is the understand the longer-term “TREND” of market prices. By looking at weekly and monthly data, the trend of prices is revealed allowing for a better match between portfolio goals and related market risks.
During “bull markets,” prices are in a steady advance with corrections to the longer-term bullish trend presenting buying opportunities. When prices become extended from the trend, such deviations provide opportunities to take profits and rebalance portfolios.
Conversely, during “bear markets,” prices are in a steady decline with corrections to the longer-term bearish trend presenting selling, hedging and shorting opportunities. When prices become extended away from the bearish trend, such deviations should be used to take profits in short positions and portfolio hedges.
This idea is shown in the chart below.
(Click on image to enlarge)
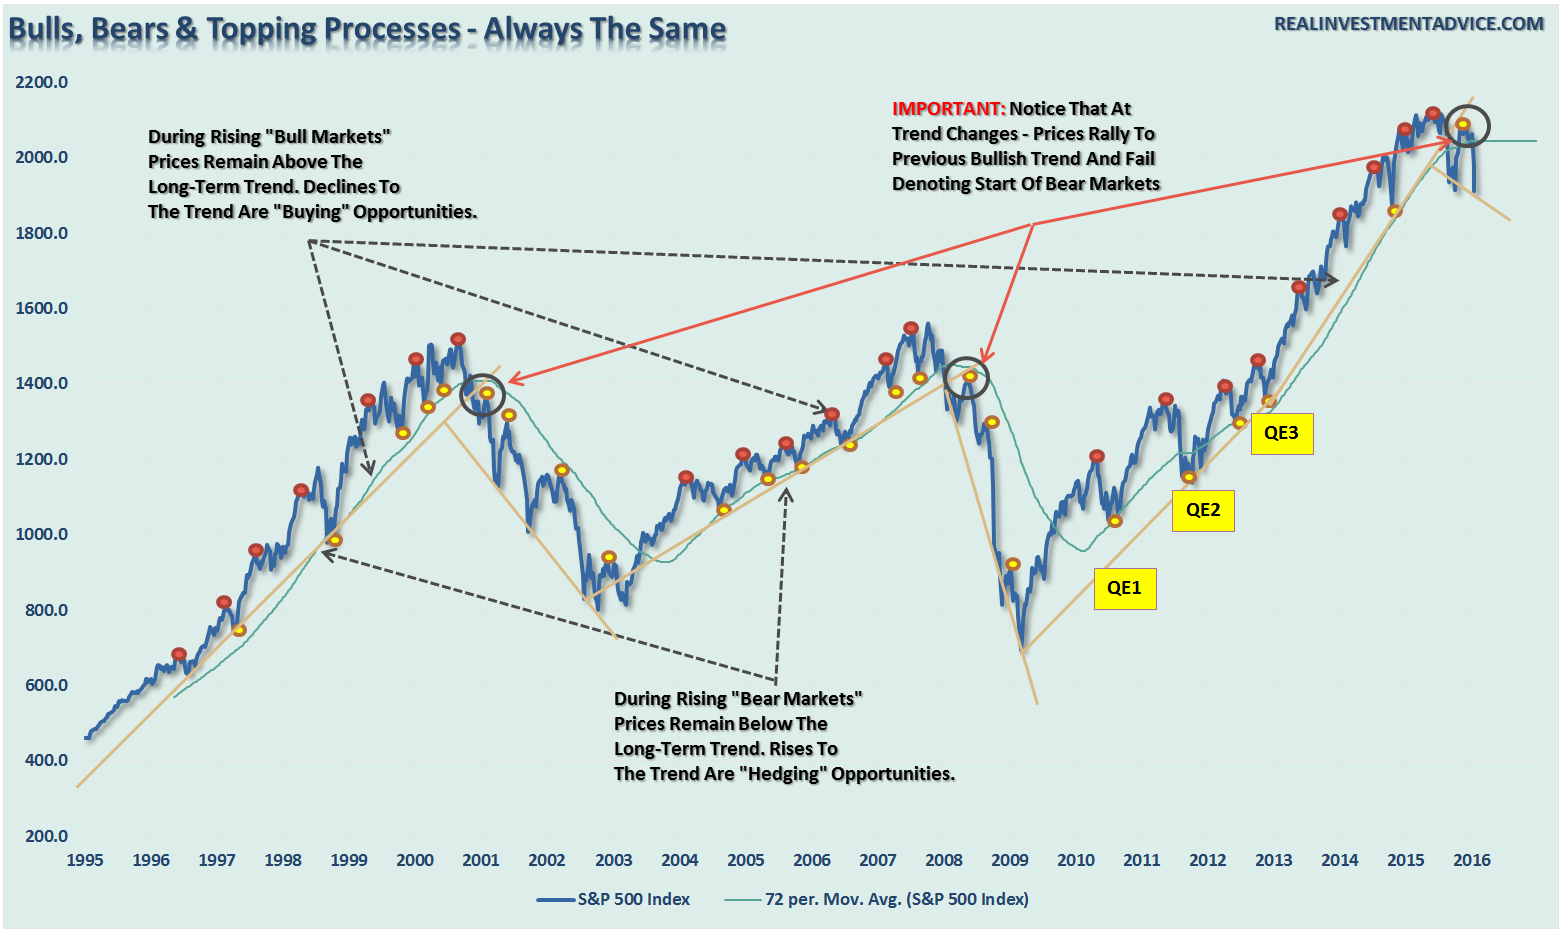
By using a 72-month (6-year) moving average, the longer-term trend of prices is more clearly revealed. As stated, corrections to the longer-term trend during bull markets were buying opportunities, whereas during bear markets they were selling/shorting opportunities.
VERY IMPORTANTLY – note that at the peak of the previous two markets the change from the bullish to bearish trend was denoted by the following price action:
- A break of the long-term moving average
- A rally back to the long-term moving
- A failure and a move lower in price than the most recent bottom.
This has now occurred with the last break in price lows for only the third time since the turn of the century.
This also takes me back to this past weekend’s newsletter where I discussed the potential completion of the “head and shoulders” topping process. To wit:
“The good news, if you want to call it that, is that the market is currently holding above the recent lows as short-term oversold conditions once again approach. It is critically important that the market holds above that support, which is also the neckline of the current “head and shoulders” formation, as a break would lead to a more substantive decline.”
(Click on image to enlarge)
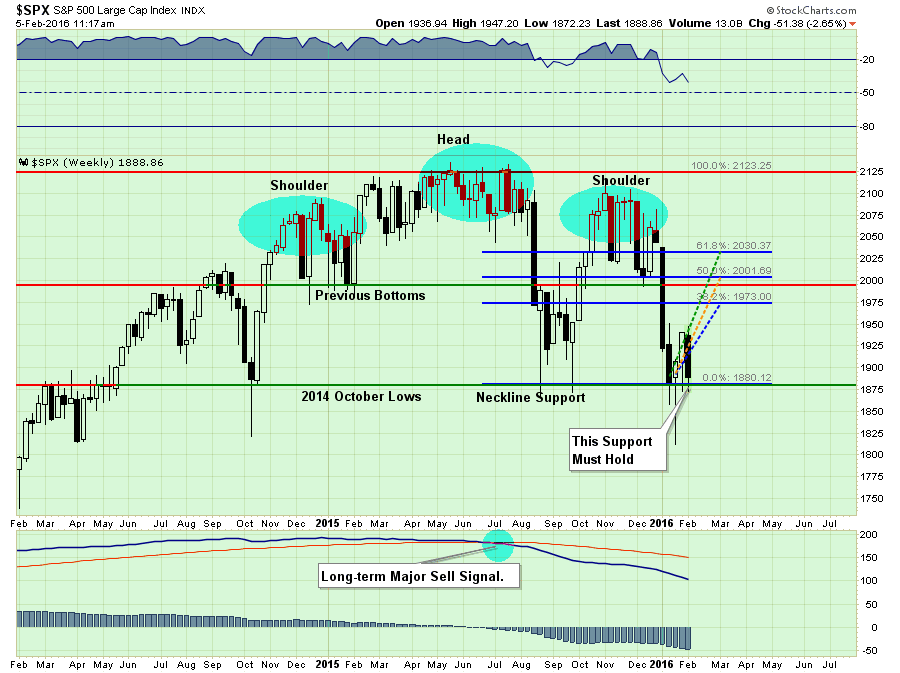
“However, this isn’t the first time that we have seen a “head and shoulders” topping pattern COMBINED with a long-term major sell signal as shown above. I emphasize this point because many short-term technicians point out“head and shoulders” formations that consistently do not lead to more important declines. However, when this topping process combines with enough deterioration in the markets to issue long-term “sell signals,” it is something worth paying attention to.
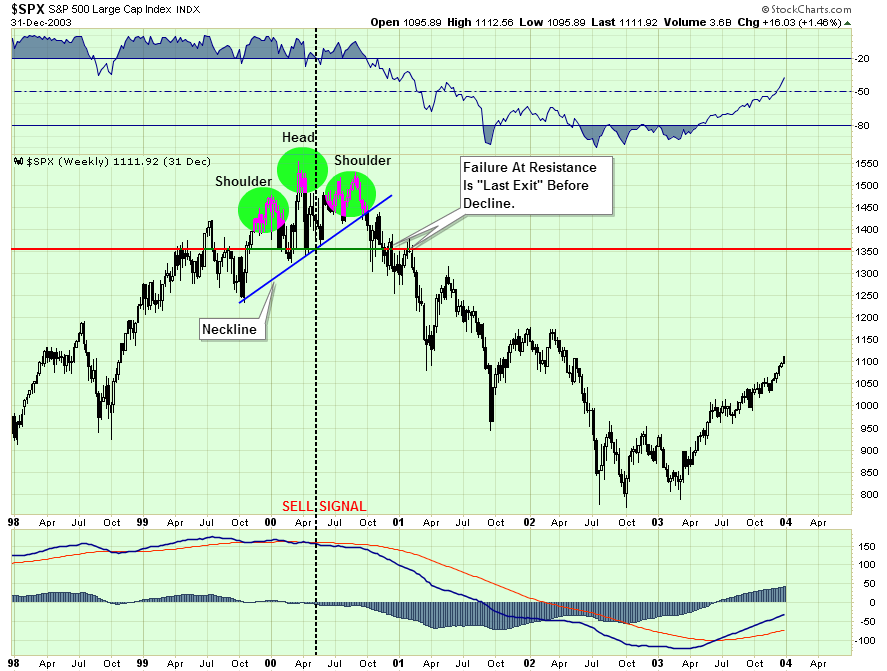
The first chart shows the same development in 2000.”
(Click on image to enlarge)
“And again in 2007.”
(Click on image to enlarge)
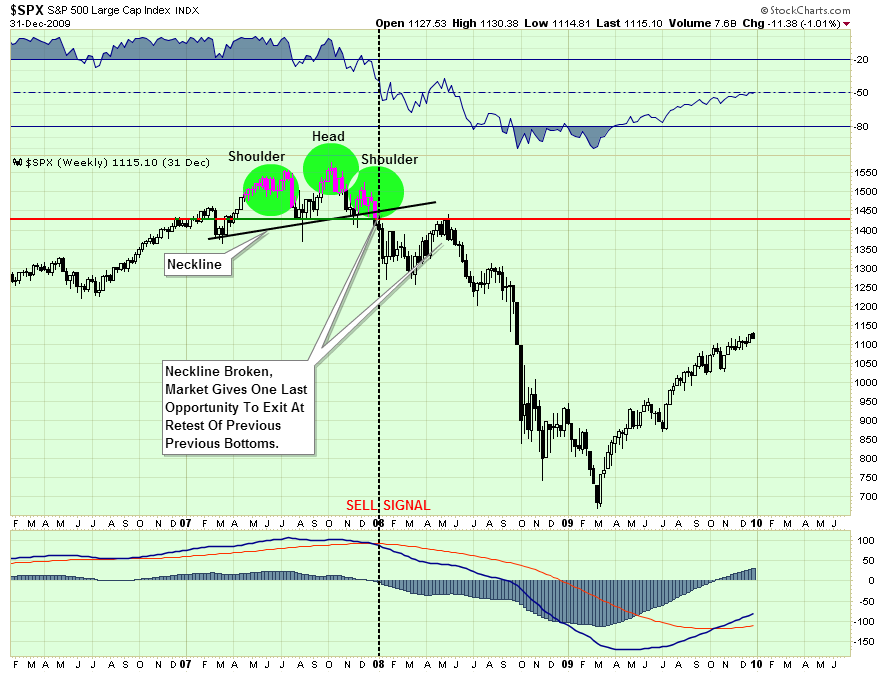
“These are the only two points since the turn of the century where a topping process was combined with a long-term sell signal.”
Importantly, no matter how we look at longer-term data, all of the messages are the same – the bull market that began in 2009 is over – for now.
3 Consecutive Negative Months & Bear Markets
Let’s take a look at another “warning flag” that is currently being waived. The S&P 500 was negative in both December and January which, according to historical statistics already suggest that 2016 will be a weak performance year. However, with February already sporting a pretty healthy decline to start the month, what does history suggest about the potential for 3-negative consecutive months.
Using the data provided by Dr. Robert Shiller, I took at look at the inflation-adjusted monthly return of the S&P 500 going back to 1900 as shown below.
(Click on image to enlarge)
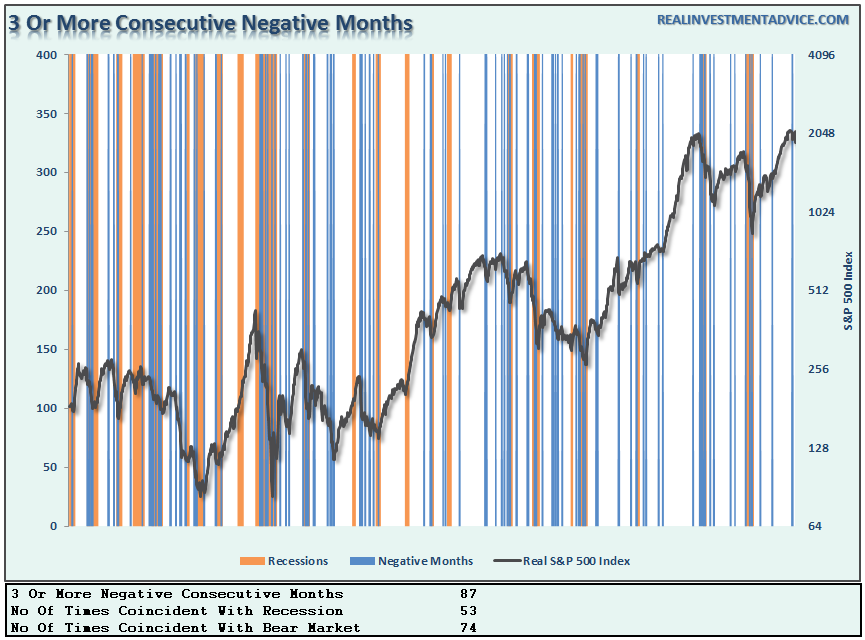
I have highlighted recessions in gold and 3-or more consecutive negative return months in blue.
Interestingly, 3-consecutive negative months is not a rarity. Since 1900, there have been 87-periods of 3-OR MORE consecutive negative months. Not surprisingly, most of them occurred either during recessionary periods or bear markets.
With the markets currently once again oversold, a bounce in the markets will not be surprising. However, for now, those bounces should be used to reduce risk, raise cash and hedge portfolios against further declines. That is, unless and until, the trend is changed back to positive.
The Psychology Of Loss
Recently, I wrote an article about the fallacies of “buy and hold” investing which received a good bit of push back from the community of advisors who tout that the only way to invest is to buy low-cost ETF’s and hold them long-term. As I penned:
“The “power of compounding” ONLY WORKS when you do not lose money.
Emotions and investment decisions are very poor bedfellows. Unfortunately, the majority of investors make emotional decisions because, in reality, very FEW actually have a well-thought-out investment plan including the advisors they work with. Retail investors generally buy an off-the-shelf portfolio allocation model that is heavily weighted in equities under the illusion that over a long enough period of time they will somehow make money. Unfortunately, history has been a brutal teacher about the value of risk management.”
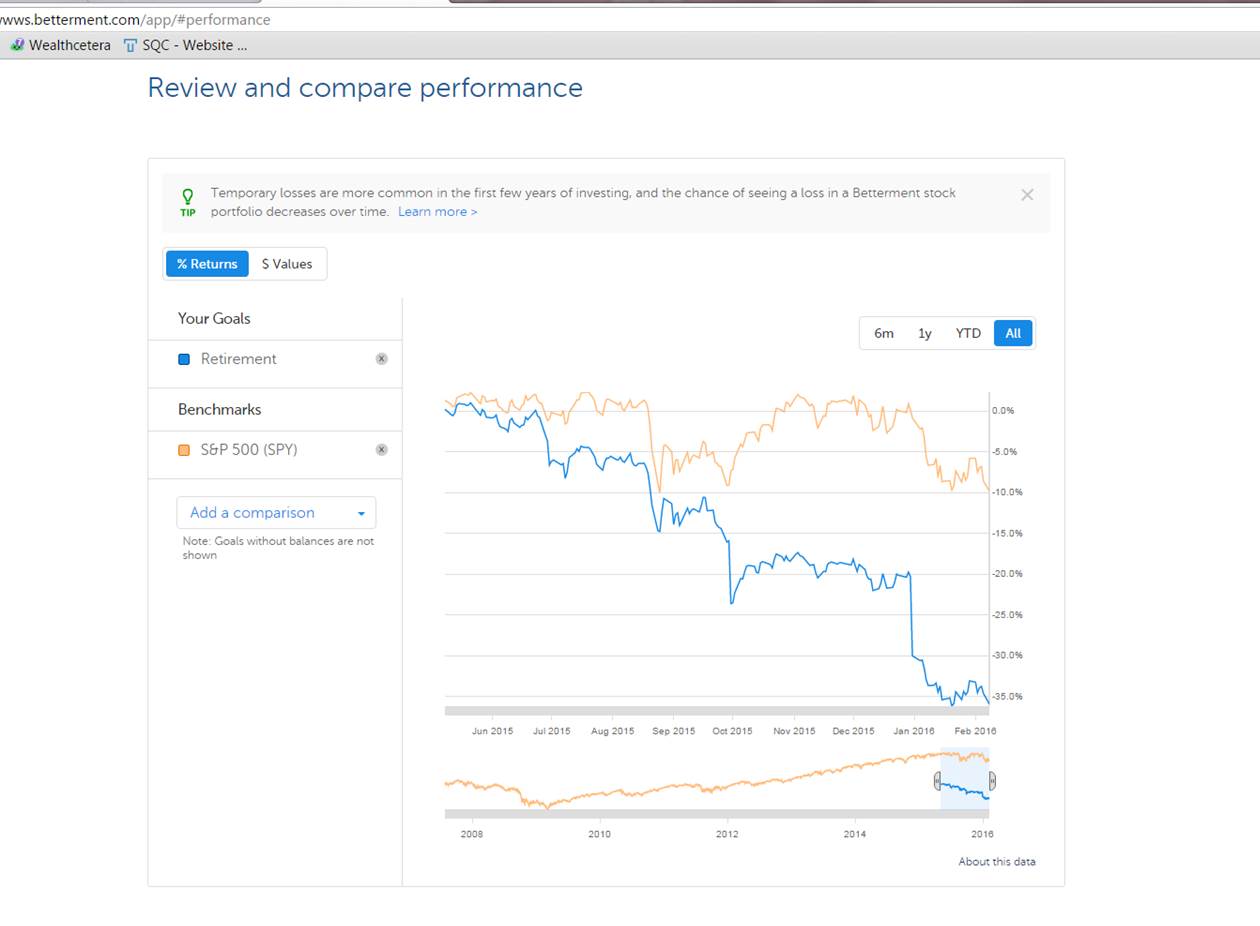
I bring this up because of an email I received from a client of Betterment, the widely touted and praised Robo-advisor.
“My portfolio is down 35% from May of last year and is with a moderate risk profile. “
(Click on image to enlarge)
“Here is the message they gave me to keep me from leaving:
‘Amongst all the edicts investors should heed, one stands out above all others: It’s time in the market that builds returns, not market timing.
We’ve illustrated this rule with one of the longest-running index data sets available: the daily returns of the S&P 500 from Jan. 2, 1928, through 2014. You can explore the difference that a few years makes by changing the slider or pressing the play button. The interactive presents the distribution of returns an investor would have received for an investment of $100 for a given holding period in the S&P 500.'”
(Click on image to enlarge)
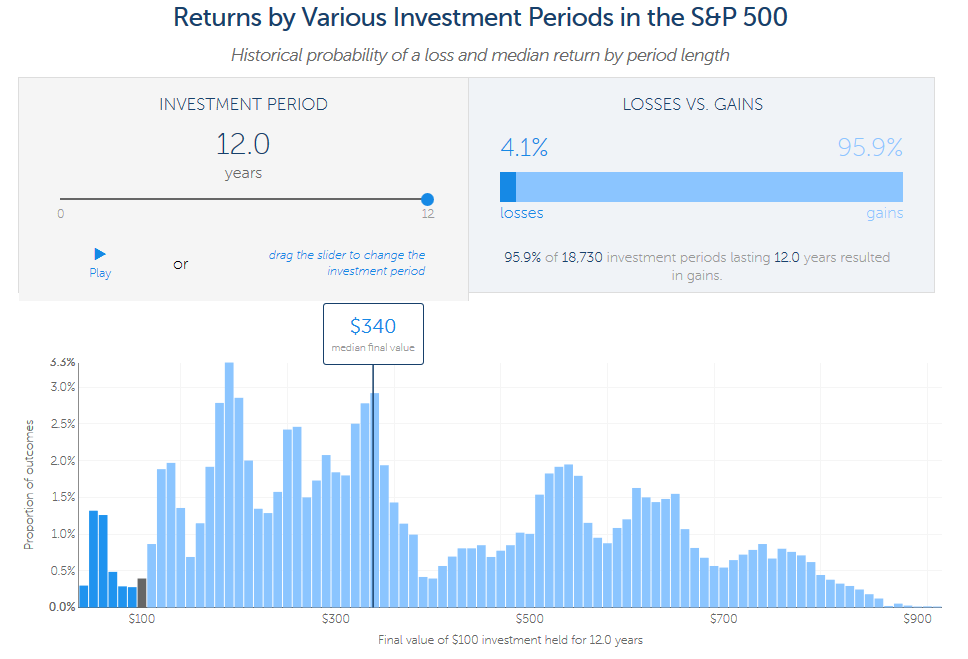
“From 1928 to 2014 there were 21,502 possible holding periods that lasted 12 months (e.g., Jan. 2, 1928, to Jan. 2, 1929; Jan. 3, 1928, to Jan. 3, 1929, etc.). Of those 21,502 holding periods, 74% resulted in positive returns with a median return of $13 on a $100 investment. On the other end of the slider, there were 18,730 possible holding periods that lasted 12 years. The returns for these holding periods were more widely dispersed and overwhelmingly positive, with a median return of $240 on a $100 investment.”
There are several problems that the investor currently faces with Betterment:
- In order to make up a 35% loss, it will require a nearly 55% return from the market. Given an average rate of return of 8% annually, it will only take a little more than 5 years to get back to even.
- That is 5-years lost toward reaching this particular individual’s retirement goals.
- While Betterment’s message to stay in for the long-term certainly sounds good, the reality is most individuals will not live long enough to achieve the long-term average rate of return.
- As with this individual, the most important problem that Betterment will now face with investors – is the loss of confidence and the emotional impact of loss.
Despite all of the arm waving and pounding on the table by advisors touting long-term average returns, time-in-the-market, etc., the psychological impact of loss is all too real. While “buy and hold” investing has its appeal during bullish trending markets, the impact of loss on individuals is a far greater emotional pull. This is why investors tend to do everything backwards by “buying high” (greed) and “selling low” (fear).
This is why managing “risk” always “wins” over the long-term by reducing the emotional pull to “do something” at precisely the wrong time.
For clients of robo-advisors, the reality of loss will be more than most can stomach and sentiments of “time in the market” will go mostly unheeded. This is, of course, why many of the coveted millennial investors have already rejected much of the Wall Street rhetoric after watching the devastation that wrecked their parents over the last 15 years.
You can do better.
Disclosure: The information contained in this article should not be construed as financial or investment advice on any subject matter. Streettalk Advisors, LLC expressly disclaims all liability in ...
more

