
Technically Speaking: Bullish Or Bearish?

Yesterday, the markets opened higher but drifted lower into the afternoon as the support behind the markets as of late have continued to remain weak.
As shown in the chart below, the markets remain trapped between the downward price trend from the summer highs and the rising bottoms from the September sell-off. Importantly, the market has maintained support at the all-important breakout level of 2125, for now. This keeps the bull market intact momentarily, but the resolution of the current consolidation will be important as to where the market goes next.
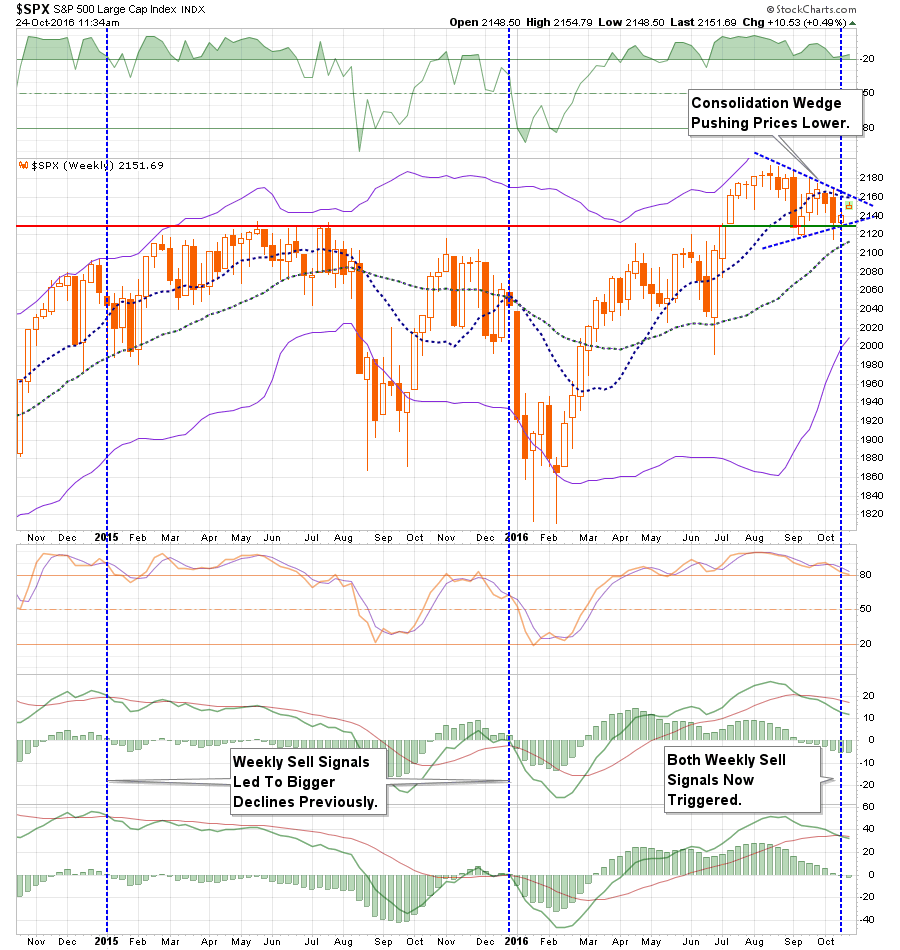
Importantly, the market has registered a confirmed weekly sell signal as shown in the bottom part of the chart.Considering this signal is being registered at fairly high levels, this suggests there is a potential for a rather deep correction at some point. However, as shown above, this process can take some months to play out.
However, in the longer-term, it is only fundamentals that matter. What is happening between the economic and earnings data is all you really need to know if you are truly a long-term investor.
Unfortunately, you aren’t.
I say that because I would be willing to bet before you even read this article you have already checked on your investments at least once today, looked at the market, and have fretted over some investment you have. True long-term investors don’t do that.
The emotional biases of being either bullish or bearish, primarily driven by the media, keep you from truly focusing on long-term outcomes. You either worry about the next downturn or are concerned you are missing the rally. Therefore, you wind up making short-term decisions which negate your long-term views.
Understanding this is the case, let’s take a look at the technical case for the markets from both a bullish and bearish perspective. From there you can decide what you do next.
THE BULL CASE
1) The Fed Won’t Let The Markets Crash
This is the primary support of the bullish case, and frankly, one that is difficult to argue with. Despite all of the hand-wringing over valuations, economics or fundamental underpinnings, stocks have been, and continue to be, elevated due either to “direct” or “verbal” accommodation.
I discussed this idea in “The Illusion oF Permanent Liquidity:”
“But what ongoing liquidity interventions have accomplished, besides driving asset prices higher, is instilling a belief there is little risk in the markets as low interest rates will continue or only be gradually tightened.”
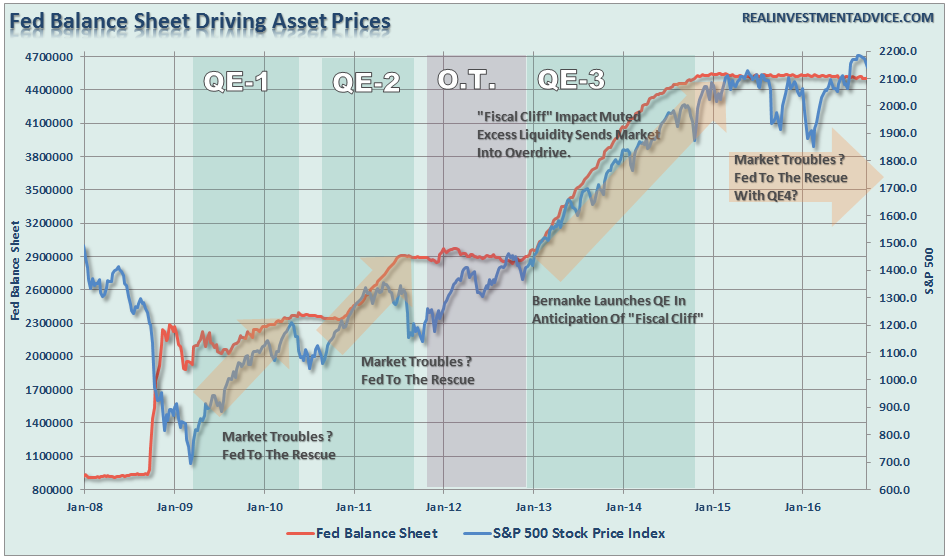
However, “verbal accommodations” have also been extremely supportive since the end of QE-3 in keeping asset prices elevated.
“Bad news is good news” has been the “siren’s song” for the bulls since the end of direct interventions as “low rates for longer” means the “chase for yield” continues.
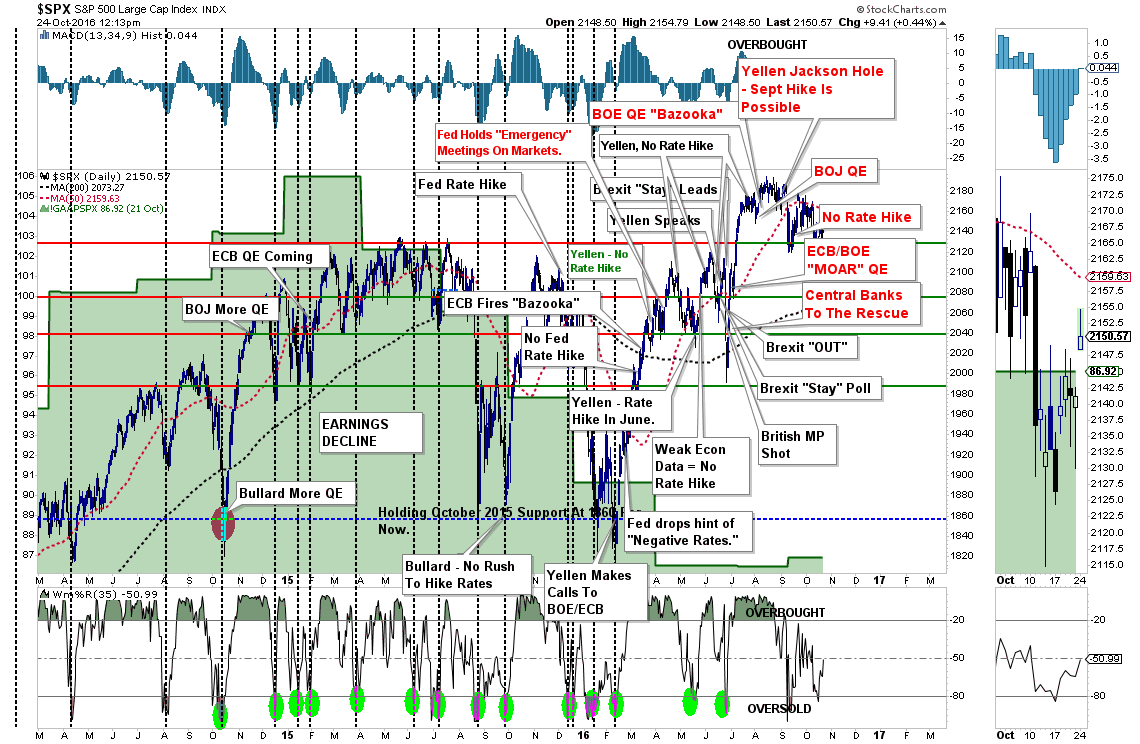
2) Stocks Have Made Successful Retest Support
As I discussed in this weekend’s newsletter, support held at the levels where the markets previously broke out to all-time highs.
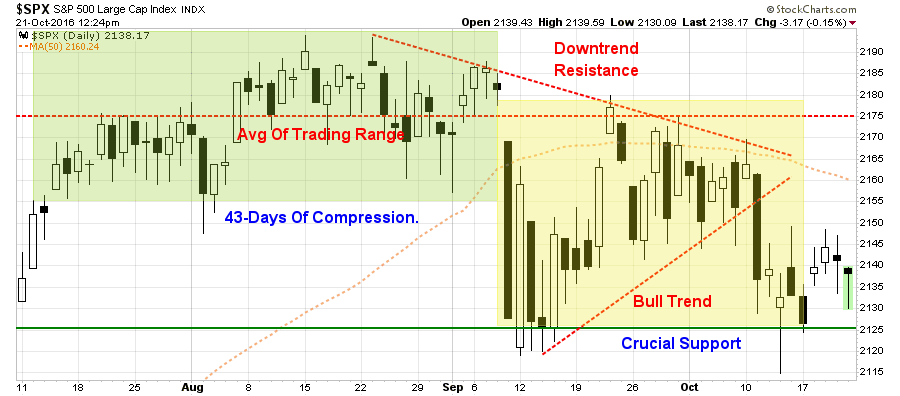
“The two dashed red lines show the tightening consolidation pattern more clearly.
Currently, the market has been able to defend crucial support at the level where the markets broke out to new highs earlier this year. However, the market now finds itself “trapped” between that very crucial support and a now declining 50-dma along with the previous bull trend support line.
Importantly, the “sell signal,” which is shown in the lower part of the first chart above, suggests that pressure remains to the downside currently.
However, there is a concerted effort currently to keep prices elevated over the last week. Following the bounce off of the critical 2125 level this past week, the market has consistently fought off weak openings and have rallied back into the close. This is shown in the chart below.”
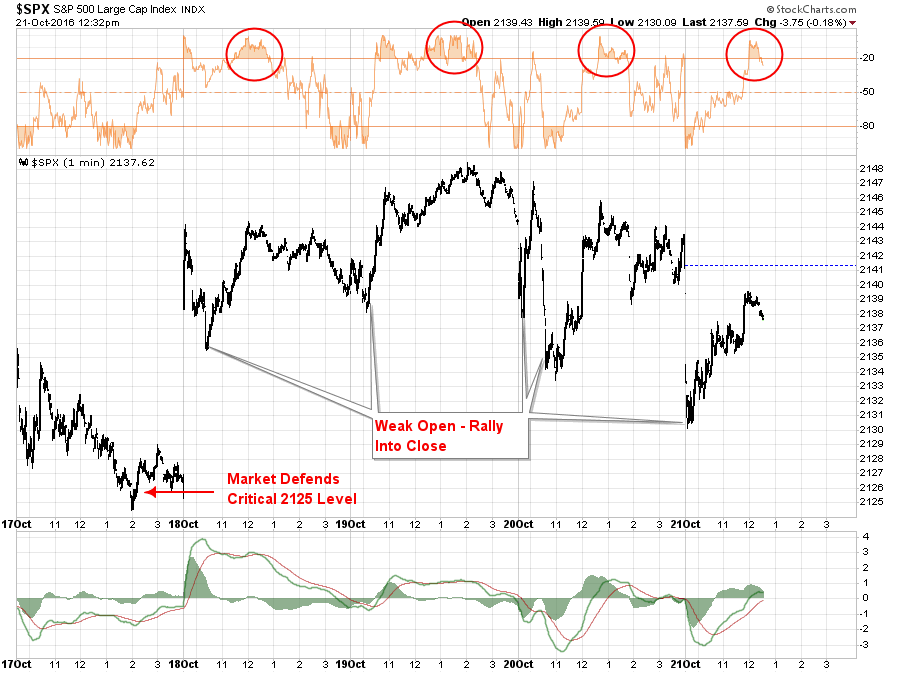
“The red circles denote when the market had reached extreme overbought levels during the trading day which typically denoted the limit of the upside advance for the day.
The broader point to be made here is that while the market is defending its current support level at 2125, the question is whether the market can muster the momentum to reconstitute the bullish trend into the end of the year. “
Despite weakness in momentum and trends currently, the market has continuously maintained support at 2125. The battle between “bulls” and “bears” is being waged at that level.
3) Advance-Decline Line Is Improving
The participation by stocks in the recent bullish advance has been strong enough to push the advance-decline line well above the 34-week moving average.
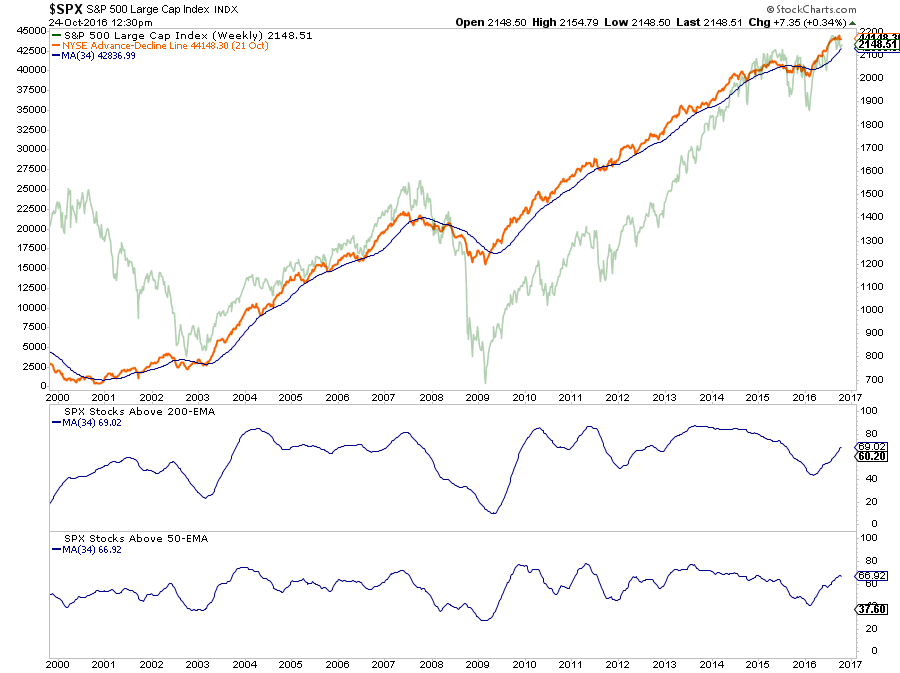
However, it should be noted that such extreme deviations from the long-term moving average do not historically last long. But, the rise in participation supports the bullish momentum behind stocks currently and should not be dismissed.
Currently, as shown above, the short-term dynamics of the market remain bullishly biased. This suggests equity exposure in portfolios remains warranted for the time being. However, let me be VERY CLEAR – this is VERY SHORT-TERM analysis. From a TRADING perspective, this remains a bull market at the current time. This DOES NOT mean the markets are about to begin the next great secular bull market. Caution is highly advised if you are the type of person who doesn’t pay close attention to your portfolio or have an inherent disposition to “hoping things will get back to even” if things go wrong rather than selling.
THE BEAR CASE
The bear case is more grounded in longer-term price dynamics – weekly and monthly versus daily which suggests the current rally remains a reflexive rally within the confines of a more bearish backdrop.
1) Short-Term: Market Momentum Declining, Fails At Resistance
The market rally from the “Brexit” lows was quite impressive as Central Banks globally came to the rescue to offset the risks of the British vote. However, since then, the markets have gone quiet.
The ongoing attempts of the market to rally have consistently failed at the downtrend from the post-Brexit highs. In order for the market to reverse the “bearish” context a breakout above that downtrend resistance will need to occur.
2) Longer-Term Dynamics Still Bearish
If we step back and look at the market from a longer-term perspective, where true price trends are revealed, we see a very different picture emerge. As shown below, the current dynamics of the market are extremely similar to every previous bull market peak in history. Given the deterioration in revenues, bottom-line earnings, and weak economics, the backdrop between today and the end of previous bull markets remains consistent.
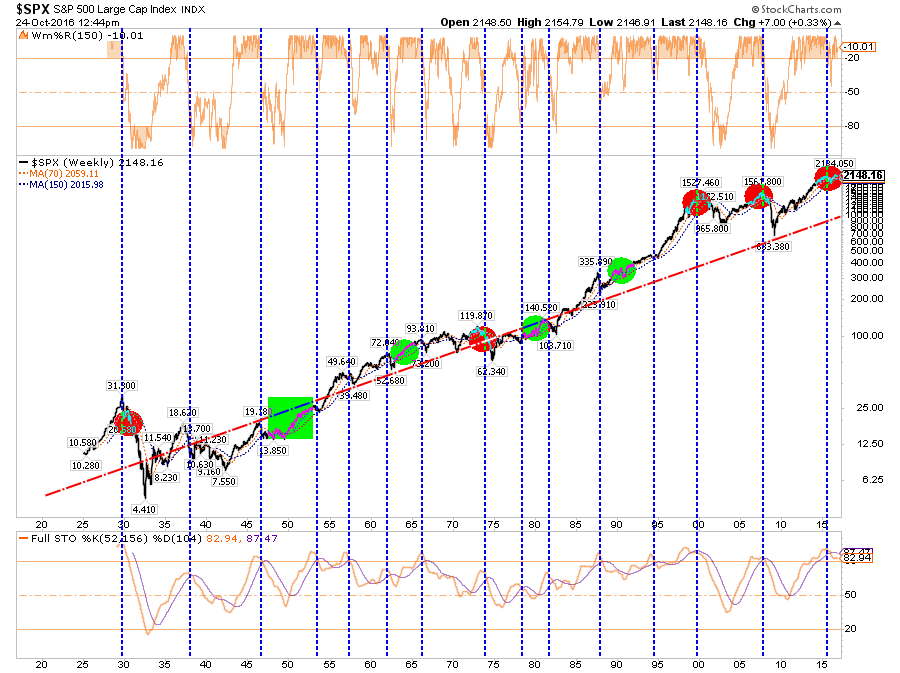
3) Technical Topping Process Still In Play
As shown below, the market continues what appears to be a more distinct topping process with bearish implications.This expanding, or “megaphone,” pattern combined with longer term “sell signals” suggests a corrective action is underway. I have mapped out the possible retracement levels using a Fibonacci sequence.
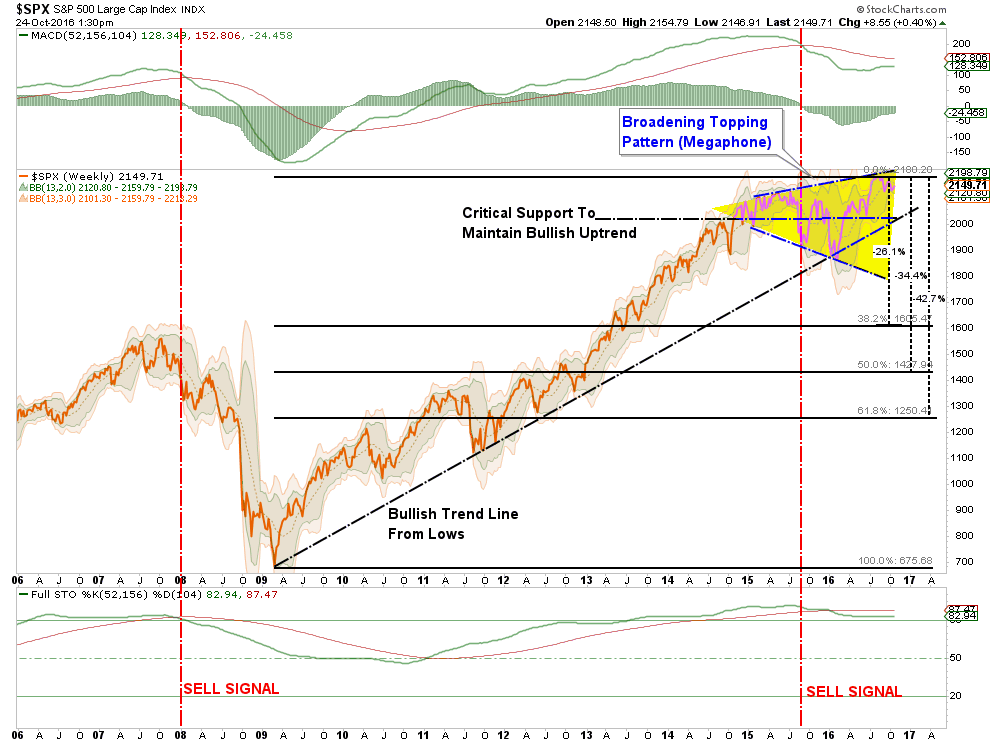
If the market is able to sustain current levels, work off the longer-term over conditions and realign prices with underlying fundamentals, the resumption of the bull market is entirely feasible. It just hasn’t ever occurred previously without a rather severe corrective process first.
What you decide to do with this information is entirely up to you. As I stated, I do think there is enough of a bullish case remaining to warrant some equity risk on a very short-term basis.
However, the longer-term dynamics are clearly bearish. When those negative price dynamics are combined with the fundamental and economic backdrop, the “risk” of having excessive exposure to the markets greatly outweighs the potential “reward. “
Could the markets rocket up to 2200, 2300 or 2400 as some analysts currently expect? It is quite possible given the ongoing interventions by global Central Banks.
The reality, of course, is that while the markets could reward you with 250 points of upside, there is a risk of 600 points of downside just to retest the previous breakout of 2007 highs
Those are odds that Las Vegas would just love to give you.
Disclosure: The information contained in this article should not be construed as financial or investment advice on any subject matter. Streettalk Advisors, LLC expressly disclaims all liability in ...
more

