
Tech Stocks: 2017 Looks Nothing Like 2000
Bubbles Speak To Unsustainable Trends
It may be surprising to some the Nasdaq made zero progress over a 6,083 calendar-day period between March 10, 2000 and November 3, 2016. The Nasdaq closed at 5,048 when the dot-com bubble peaked in 2000. Fast-forward 16.66 years and we find the Nasdaq closed at 5,046 (two points below the 2000 peak) on November 3, 2016.
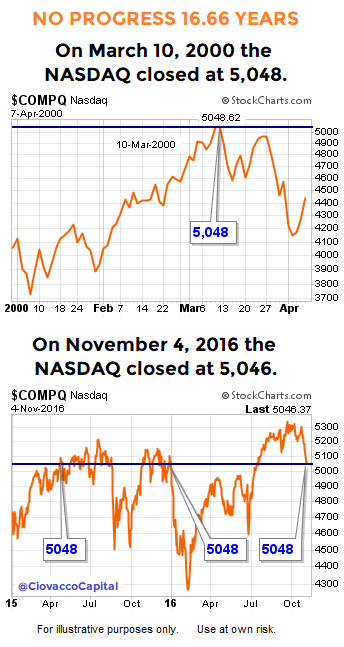
An index that makes no progress over a 6,083-day period does not sound like an index in a bubble.
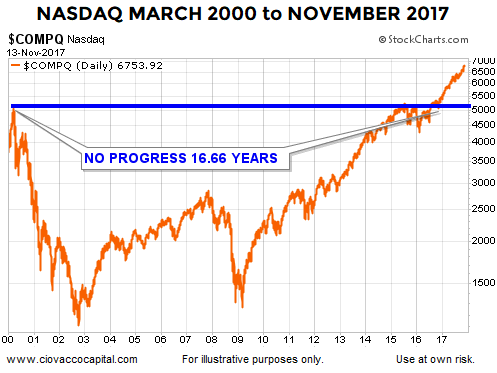
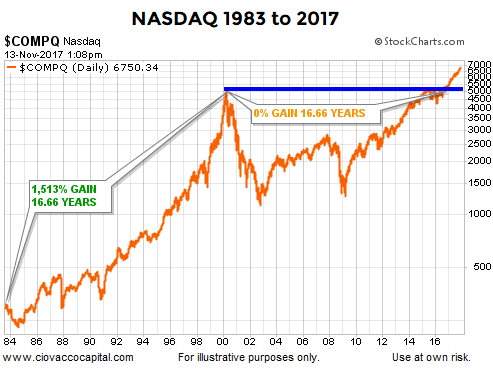
How Do The Last 16.66 Years Of The 2000 Bubble Compare?
The 0% gain that occurred between 2000 and 2016 does not sound like an unsustainable bullish trend or euphoric gains. In fact, a 0% gain is quite a bit different from the “this time is different” 1,513% gain that occurred during the 16.66 years leading up to the bursting of the dot-com bubble.
This Signal Has Only Occurred Two Times In The Last 60 Years
If we examine annual charts for the S&P 500 dating back to the 1950s, will we find what appears to be a major topping process or will we find something much more constructive? The answer can be found in this week’s stock market video.
Tech 2017: Impressive Earnings Growth
During the latter stages of the dot-com bubble, actual earnings took a back seat to hype about the “this changes everything” Internet. The Internet has ushered in numerous economic shifts, but companies still need to see some real revenue along the way. The 2017-18 stats below were compiled by Goldman Sachs and appeared in a recent Bloomberg story:
- The FAAMG group [Facebook (FB), Apple (AAPL), Amazon (AMZN), Microsoft (MSFT), Google (GOOGL)] saw collective sales expanding 21 percent in the third quarter, the fastest pace in more than five years and three times the growth rate in S&P 500 revenue.
- Tech strength is not limited to just FAAMG. Overall industry profit grew 22%, beating all other sectors except for energy.
- More than 80 percent of tech firms beat earnings estimates by more than one standard deviation, the best performance in at least 19 years; Apple, Microsoft, Facebook and Google accounted for half of the S&P 500’s index-level surprise.
- Tech profit margins expanded by 72 basis points, countering a decline expected by analysts.
- FAAMG growth supremacy will continue in 2018, with sales seen increasing 20 percent, versus 11 percent for S&P 500.
- Thanks to solid earnings, FAAMG valuations aren’t particularly out of whack with history, even with their outsize returns. The group’s enterprise value sits at 4.9 times sales, versus 2.3 for the S&P 500, in line with the 10-year average, data from Goldman showed.
Disclaimer: The opinions in this document are for informational and educational purposes only and should not be construed as a recommendation to buy or sell the stocks mentioned or to solicit ...
more

