
T2108 Update – The Volatility Index Hits A New Milestone On Follow-Through Stock Buying
(T2108 measures the percentage of stocks trading above their respective 40-day moving averages [DMAs]. It helps to identify extremes in market sentiment that are likely to reverse. To learn more about it, see my T2108 Resource Page. You can follow real-time T2108 commentary on twitter using the #T2108 hashtag. T2108-related trades and other trades are occasionally posted on twitter using the #120trade hashtag. T2107 measures the percentage of stocks trading above their respective 200DMAs)
T2108 Status: 15.9%
T2107 Status: 23.0%
VIX Status: 26.1
General (Short-term) Trading Call: Bullish
Active T2108 periods: Day #5 below 20% (oversold), Day #6 under 30%, Day #29 under 40%, Day #69 under 50%, Day #86 under 60%, Day #284 under 70%
Reference Charts (click for view of last 6 months from Stockcharts.com):
S&P 500 or SPY
SDS (ProShares UltraShort S&P500)
U.S. Dollar Index (volatility index)
EEM (iShares MSCI Emerging Markets)
VIX (volatility index)
VXX (iPath S&P 500 VIX Short-Term Futures ETN)
EWG (iShares MSCI Germany Index Fund)
CAT (Caterpillar).
Commentary
Buyers managed to stage follow-through buying to yesterday’s notable end to a long losing streak. Incredibly, the S&P 500 is now ABOVE where it closed on Friday and so is UP for the week. Such is the power of a bounce from oversold conditions.
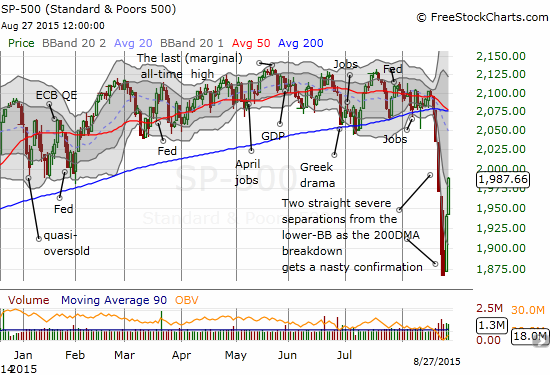
The S&P 500 has gained a whopping 6.2% as its bounce from oversold conditions gets underway.
This chart is Exhibit A of why sellers and bears should NEVER chase a market down when it is oversold: such trading is a recipe for whiplash or major losses. Anyone who sold into that panic selling at the close on Tuesday is experiencing seller’s regret right now. So the pressure turns to the sellers to decide whether to cover and/or jump back into the market before “it gets away.” Note well, I am NOT saying the market has found its ultimate bottom. Instead, I am speaking from the standpoint of properly managing risks relative to potential gains.
T2108 is still oversold at a close of 15.9%. T2108 lags the S&P 500 given it has not yet recovered to last Friday’s close. At the current pace, T2108 could easily exit oversold conditions by Friday’s close. Friday should represent an interesting battle between short-term traders who want to lock in profits before the uncertainty of the weekend versus bears and sellers who might rush to cover/buy fearing that “world peace” over the weekend could send the market gapping up on Monday. At 5 days and running in the oversold period, T2108 is right at the average duration for an oversold period. So, time SHOULD indeed be running out for the oversold period.
Even more importantly, the volatility index, the VIX, hit its next milestone on the downside. The VIX closed below the low of the last major surge; it now sits below the intraday high from 2012.
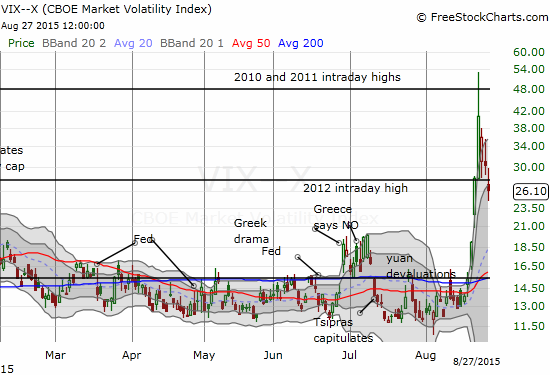
The volatility index, the VIX, has now lost half its value from the intraday high just three days ago.
This milestone gives the green light to less aggressive traders/investors to do some buying. However, the current setup is a great reminder of why I prefer the more aggressive strategy. Being aggressive can deliver better risk/reward setups. By buying on volatility spikes to new highs, I very quickly nailed an extremely high profit opportunity on this upswing. Traders and investors buying here face the very real risk of a natural pullback. The S&P 500 is up 6.2% in just two days – even a 3% pullback over a few days would be quite normal.
This pullback risk increases for traders/investors who follow the “conservative” strategy of waiting until the oversold period ends to do some buying. Granted, my early analysis of drawdowns for different strategies showed that the less aggressive strategies effectively limited big drawdowns. This cap on losses comes at the “cost” of more limited upside as well.
I am going to call Friday a “toss-up” day, so no individual stock charts (I will reload chart this weekend! There are many good ones). Here is a quick summary of the trades I did: added to Caterpillar (CAT) put options as a SMALL hedge, locked in more profits on ProShares Ultra S&P500 (SSO) call options, sold AAPL call options for a nice profit, sold NFLX call options for an even better profit, and restarted a “strangle” on iShares MSCI Emerging Markets (EEM) which features out of the money put and call options. I have discussed the strategy on EEM in several earlier posts. I have yet to capture gains on both sides of the trade, but I have consistently been able to log large enough gains on one side (mainly the put side!) to more than pay for the losing side. I fully expect more major moves ahead for EEM.
The iShares Nasdaq Biotechnology ETF (IBB) made its own important milestone: it closed above its 200DMA. This technically makes it a screaming buy. IBB is one of my biggest misses during the panic earlier this week. I did buy a call option last Friday, but it will likely expire tomorrow (August 28th) worthless. (When I finally get my short-term timing right on IBB, it will be huge!).
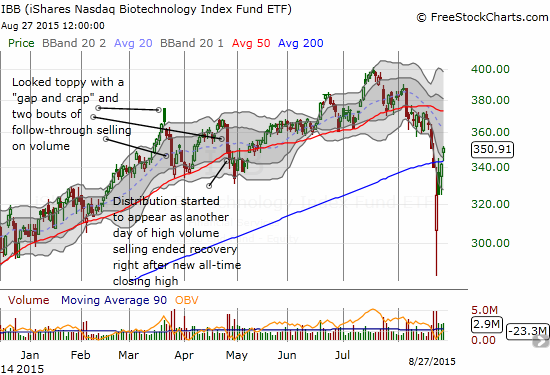
The healing for iShares Nasdaq Biotechnology has arrived in the form of a solid close above the 200DMA upward trendline.
Finally, I want to demonstrate why it is important to follow currency markets during times of stress like this one.
euro recovering and $AUDJPY looks topped out. Likely signals $SPY rally has or is topping out for the day. #forex
— Duru A (@DrDuru) Aug. 27 at 09:03 PM
As I have noted earlier, I am keeping a close watch on the Australian dollar (FXA) versus the Japanese yen (FXY) as a market tell. It worked like a charm today although I did not act on a trade. The move on ProShares Short VIX Short-Term Futures (SVXY) was simply too fast for my non-computer brain. At least I knew that buying near that top was a very poor risk/reward proposition.
euro recovering and $AUDJPY looks topped out. Likely signals $SPY rally has or is topping out for the day. #forex
— Duru A (@DrDuru) Aug. 27 at 09:03 PM
Anyway, check out the very tight correlation between AUD/JPY and the S&P 500. I included an overlay (blue) of EUR/USD for comparison. While the euro is behaving inversely to the S&P 500, it is not as tightly related as AUD/JPY. The euro’s inverse relationship will only last as long as traders are closing out carry trades; I have to believe they are almost finished at this point.
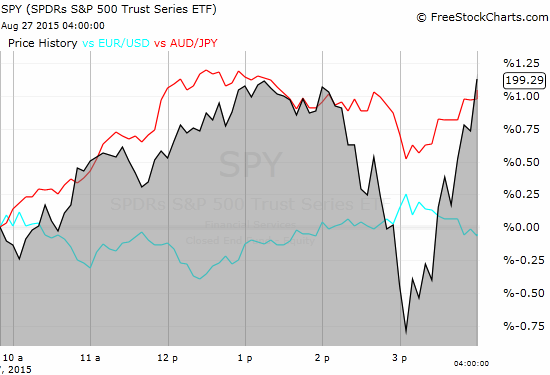
The Australian dollar versus the Japanese yen (AUD/JPY) topped out ahead of the S&P 500 – it was only a matter of time before the index topped as well. The subsequent plunge was supported by the sudden drop in AUD/JPY.
Daily T2108 vs the S&P 500

Black line: T2108 (measured on the right); Green line: S&P 500 (for comparative purposes)
Red line: T2108 Overbought (70%); Blue line: T2108 Oversold (20%)
Weekly T2108

*All charts created using freestockcharts.com unless otherwise stated
The charts above are the my LATEST updates independent of the date of this given T2108 post. For my latest T2108 post click here.
Related links:
The T2108 Resource Page
Expanded daily chart of T2108 versus the S&P 500
Expanded weekly chart of T2108
Be careful out there!
Full disclosure: long SVXY shares, long SSO shares and call options, long WDAY call options, long UVXY put options, short USO puts, short USO call ...
more

