
T2108 Update – The S&P 500’s Post-Fed Celebration Comes To A Pre-Debate End
(T2108 measures the percentage of stocks trading above their respective 40-day moving averages [DMAs]. It helps to identify extremes in market sentiment that are likely to reverse. To learn more about it, see my T2108 Resource Page. You can follow real-time T2108 commentary on twitter using the #T2108 hashtag. T2108-related trades and other trades are occasionally posted on twitter using the #120trade hashtag. T2107 measures the percentage of stocks trading above their respective 200DMAs)
T2108 Status: 42.4%
T2107 Status: 69.3%
VIX Status: 14.5
General (Short-term) Trading Call: neutral
Active T2108 periods: Day #152 over 20%, Day #8 over 30%, Day #2 over 40% (overperiod), Day #2 under 50% (underperiod), Day #12 under 60%, Day #40 under 70%
Commentary
The stock market can be strange. Even though the date of the U.S. Presidential debate has been known for a very long time, it seems the stock market went into risk reduction mode only when the debate was on the very doorstep. The pre-debate retreat was sharp enough to finish a complete reversal of post-Fed gains on the S&P 500 (SPY). Resistance at the 50-day moving average (DMA) looks confirmed.

The S&P 500 seems to confirm resistance at its 50-day moving average (DMA).
The financial sector was another likely driver of the day’s jitters. The Financial Select Sector SPDR ETF (XLF) dropped 1.6% on the day. This was much worse than the 0.9% drop in the S&P 500.
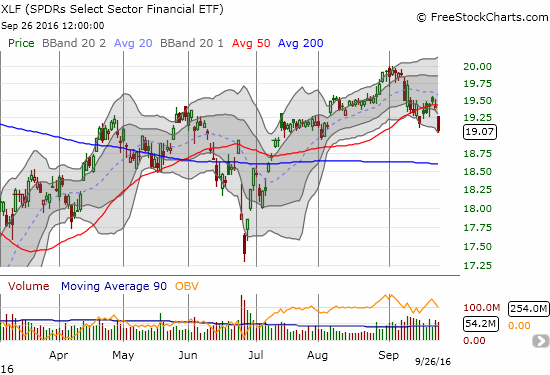
Financial Select Sector SPDR ETF appeared to confirm a 50DMA breakdown with a new 7+ week low.
All the selling drove T2108, the percentage of stocks trading above their 40DMAs, from 49.6% to 42.4%. The selling was broad-based.
In the last T2108 Update, I did not dare guess what would send the volatility index, the VIX, jumping off what I described as the VIX’s launching pad. I sure could not have guessed that the launch would come in just one day.
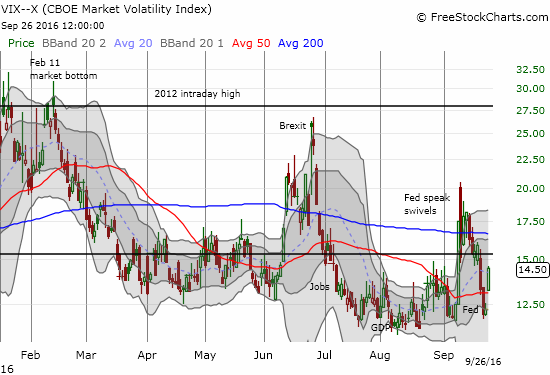
The volatility index, the VIX, pops for a 1-day 18% gain.
Skeptical of this surge, I faded volatility by selling a call option against my shares in ProShares Ultra VIX Short-Term Futures (UVXY). I even bought put options. I am looking to close out both positions this week.
I was also caught by surprise by the sharp reactions to the debate in the currency market. Risk aversion swept across forex in the hour ahead of the debate. As such things go, the quick trigger reactions soon gave way to a major relief run. At the time of writing, the Japanese yen (FXY) and the U.S. dollar (DXY0) are right back to their pre-debate starting blocks. The 5-minute charts of GBP/JPY and USD/CAD display the roundtrips from the debate-related jitters and then relief. These moves generated some good very short-term trading opportunities. They also make me think that pre-debate jitters was the more dominant theme in Monday’s stock market trading.
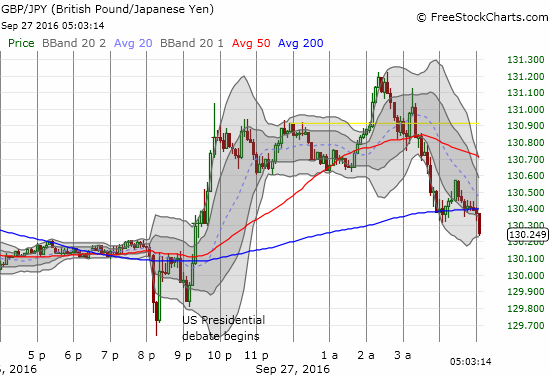
The Japanese yen surged sharply and briefly ahead of the U.S. Presidential debate. Major relief ensued afterward for GBP/JPY.
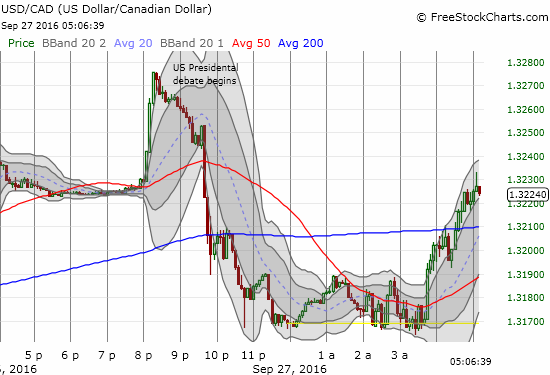
The U.S. dollar surged (against the Canadian dollar) ahead of the debate. The gains for USD/CAD quickly evaporated.
So going forward I will be more on alert on potential reactions to election-related reactions in financial markets. For now, it seems the post-Fed celebration has come to a close and pre-election reality has descended upon the landscape.
Daily T2108 vs the S&P 500

Black line: T2108 (measured on the right); Green line: S&P 500 (for comparative purposes)
Red line: T2108 Overbought (70%); Blue line: T2108 Oversold (20%)
Weekly T2108

*
All charts created using freestockcharts.com unless otherwise stated
The charts above are the my LATEST updates independent of the date of this given T2108 post. For my latest T2108 post click here.
Related links: The T2108 Resource Page
Full disclosure: long SDS, long UVXY shares, short UVXY call options, long UVXY puts, short GBP/JPY, short USD/CAD


