
T2108 Update – Sellers Maintain Control Of The Stock Market
(T2108 measures the percentage of stocks trading above their respective 40-day moving averages [DMAs]. It helps to identify extremes in market sentiment that are likely to reverse. To learn more about it, see my T2108 Resource Page. You can follow real-time T2108 commentary on twitter using the #T2108 hashtag. T2108-related trades and other trades are occasionally posted on twitter using the #120trade hashtag. T2107 measures the percentage of stocks trading above their respective 200DMAs)
T2108 Status: 6.1%
T2107 Status: 15.5%
VIX Status: 36.0%
General (Short-term) Trading Call: Bullish
Active T2108 periods: Day #3 below 20% (oversold), Day #4 under 30%, Day #27 under 40%, Day #67 under 50%, Day #84 under 60%, Day #283 under 70%
Reference Charts (click for view of last 6 months from Stockcharts.com):
S&P 500 or SPY
SDS (ProShares UltraShort S&P500)
U.S. Dollar Index (volatility index)
EEM (iShares MSCI Emerging Markets)
VIX (volatility index)
VXX (iPath S&P 500 VIX Short-Term Futures ETN)
EWG (iShares MSCI Germany Index Fund)
CAT (Caterpillar).
Commentary
The sellers kept up the pressure today. Futures were notably weak before the open. Yet, buyers showed up in time to gap the market up in a move that COULD have confirmed an oversold bottom. Instead, the sellers immediately moved to retake control, and the ball rolled all downhill from there. T2108 closed at a fresh low of 6.1%!
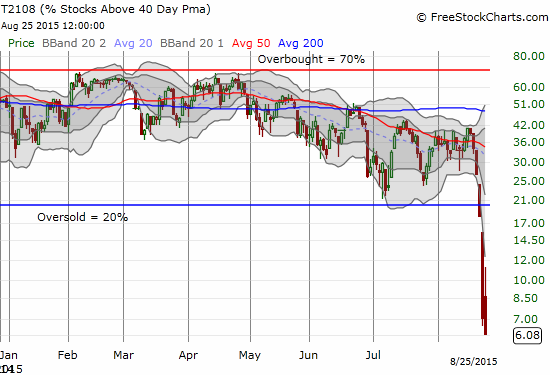
How low will T2108 go?
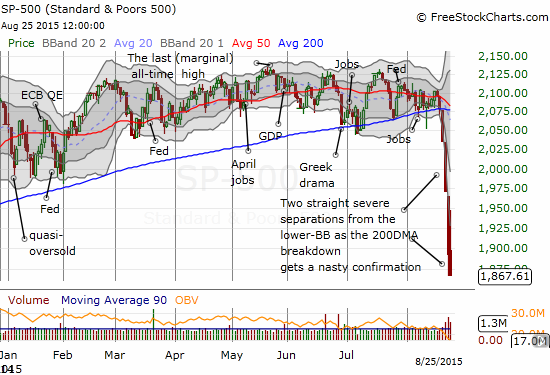
The S&P 500 closes for a loss for the 6th straight day…aand below the lower-Bollinger Band for an amazing fourth straight day
The sellers remain strong as they have been able to press the S&P 500 for a fourth straight day below its lower-Bollinger Band (BB). The index has lost 11.2% over six straight days of selling. Whenever the buyers return to bring some balance, the resultant rally is likely to be very impressive.
Here is a chart of the NASDAQ (QQQ) for additional context. The tech-heavy index closed with a fractional loss only because Monday’s low (and open) were so incredibly (and unbelievably) deep. The NASDAQ has lost 11.5% in six days of selling.
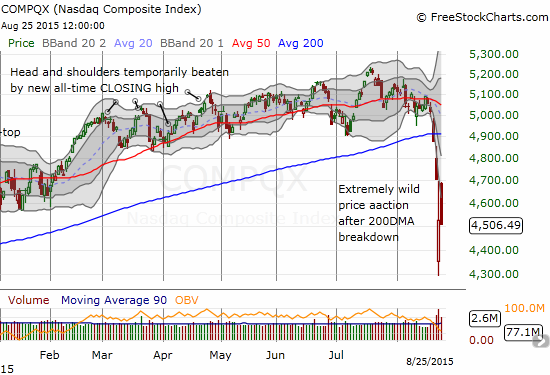
Little consolation a the NASDAQ’s selling did not create a new low.
According to the rules I laid out yesterday, there were no trades to make no matter your risk preference. The VIX managed to trade perfectly between the previous day’s high and low. As a reminder, a break to a new high gets aggressive traders buying. Less aggressive buyers wait until the VIX CLOSES below a previous low.
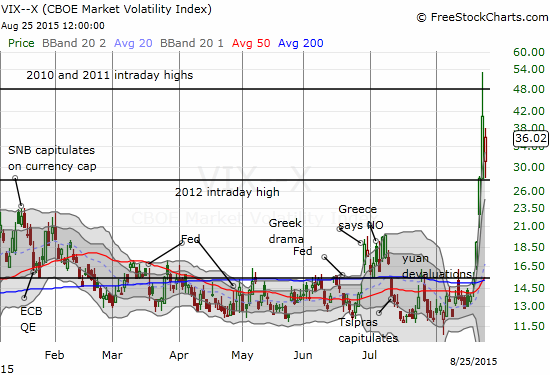
The volatility index swings through a wide range but stays “in bounds”
This action translated into large moves in the volatility products. ProShares Short VIX Short-Term Futures (SVXY) plunged into the close while ProShares Ultra VIX Short-Term Futures (UVXY) is putting on a rare display of resilience.
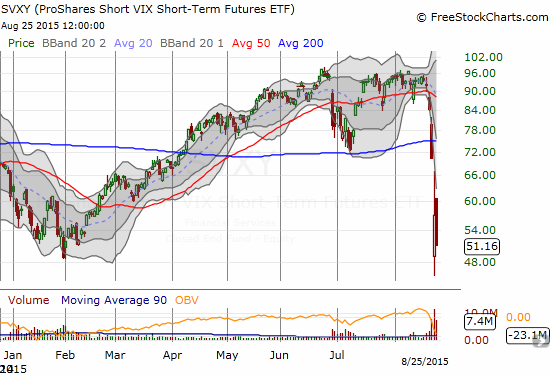
ProShares Short VIX Short-Term Futures (SVXY) gets crushed again as an initial rally quickly fades
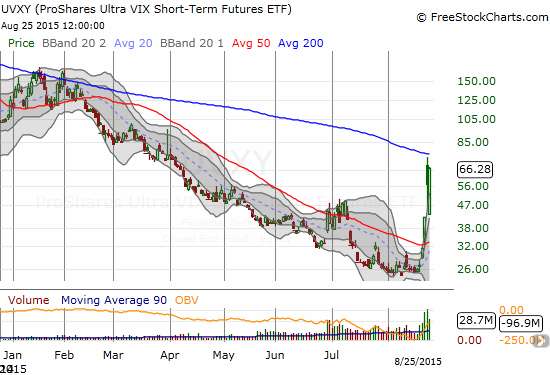
ProShares Ultra VIX Short-Term Futures (UVXY) reaches again for its 200DMA downtrend
Although the trading rules did not trigger, I did execute three key trades.
With T2108 oversold, I set at least one limit order for call options on ProShares Ultra S&P500 (SSO) at a low ball price to catch a plunge while I am not monitoring the stock market. Surprisingly, my low ball offer of the day triggered near the close. I guess it makes sense given the rush of selling. Again, I strongly prefer at this stage of the oversold period to buy additional positions when the VIX is surging to new heights.
The second trade was on shares of ProShares Short VIX Short-Term Futures (SVXY). The plunge into the close looked so much like panic that I could not resist buying back into SVXY for the next short-term swing. This is even more speculative than usual given the VIX did not print a new high.
Finally, the third trade was a two-for-one on solar stocks Canadian Solar (CSIQ) and First Solar (FSLR). I included CSIQ in my shopping list of stocks on the first oversold daybecause I concluded the stock was “ridiculously” oversold. I took a risk and bought as CSIQ faded to close the opening gap up (I wish I had CSIQ on the list for Monday’s plunge!). I set a tight limit order to sell at $18 since I am already holding call options. Fortunately, the stock proceeded to rally straight up and took out my price target in short order. After CSIQ, I took a look at FSLR and decided to jump back into my favorite solar stock with call options.
Unfortunately, both CSIQ and FSLR hit walls later in the day along with the market and ended up closing at their lows. FSLR was turned back from resistance at its 50DMA. CSIQ has a chart commonly seen in the market right now: a gap down and a rally on Monday; a gap up and a fade on Tuesday – almost a “sloppy” abandoned baby bottom except the upside showed too little conviction. The battle between bears and bulls, sellers and buyers is just getting warm.
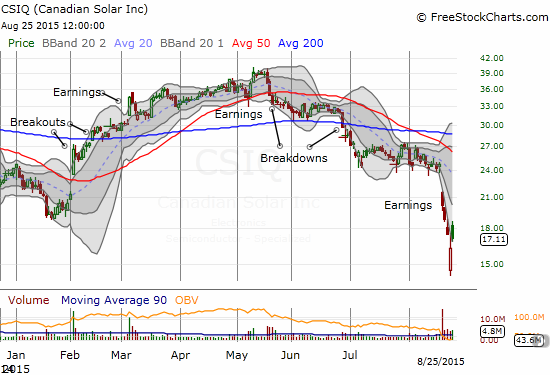
Canadian Solar (CSIQ) is struggling like so many stocks to pick itself up and out of deeply oversold conditions in what ALMOST looks like an abandoned baby bottom.
Here is what a proper abandoned baby bottom looks like (from Steve Nison’s Candlecharts.com):
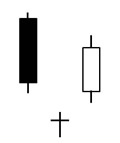
Source: Candlecharts.com
Nison: “A very rare Japanese candlestick top or bottom reversal signal. It is comprised of a doji star that gaps away (including shadows) from the prior and following sessions’ candlesticks. This is the same as a Western island top or bottom in which the island session is also a doji.”
Me: An abandoned baby bottom "traps" bears and sellers on the second day. These sellers assumed the big gap down confirmed the bearishness of the selling on the first day.
Finally, finally…a nod to China’s increasing woes with this short news video from a Canadian network followed by chart showing the on-going collapse of the Shanghai Composite Index (SSEC).
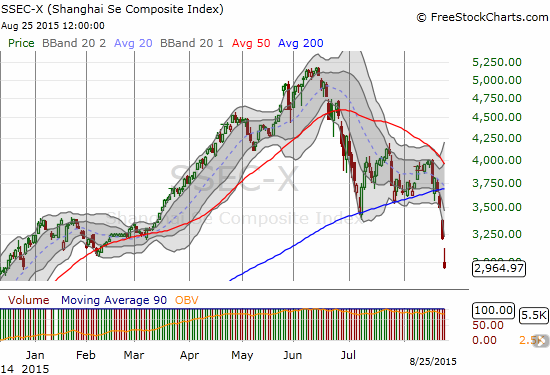
The Chinese government loses control of the Shanghai Composite Index as it continues to collapse from its 200DMA breakdown. This reverses a gain that was as high as 59% for 2015.
Daily T2108 vs the S&P 500

Black line: T2108 (measured on the right); Green line: S&P 500 (for comparative purposes)
Red line: T2108 Overbought (70%); Blue line: T2108 Oversold (20%)
Weekly T2108

*All charts created using freestockcharts.com unless otherwise stated
The charts above are the my LATEST updates independent of the date of this given T2108 post. For my latest T2108 post click here.
Related links:
The T2108 Resource Page
Expanded daily chart of T2108 versus the S&P 500
Expanded weekly chart of T2108
Be careful out there!
Disclosure: No positions.


