
T2108 Update – Inauguration Eve Draws More Bearish Divergence
(T2108 measures the percentage of stocks trading above their respective 40-day moving averages [DMAs]. It helps to identify extremes in market sentiment that are likely to reverse. To learn more about it, see my T2108 Resource Page. You can follow real-time T2108 commentary on twitter using the #T2108 hashtag. T2108-related trades and other trades are occasionally posted on twitter using the #120trade hashtag. T2107 measures the percentage of stocks trading above their respective 200DMAs)
T2108 Status: 55.2%
T2107 Status: 65.3%
VIX Status: 12.8
General (Short-term) Trading Call: bearish
Active T2108 periods: Day #230 over 20%, Day #50 over 30%, Day #49 over 40%, Day #47 over 50% (overperiod), Day #1 under 60% (underperiod), Day #10 under 70%
Commentary
T2108, the percentage of stocks trading above their respective 40-day moving averages (DMAs), last topped out on January 4, 2016. My favorite technical indicator has declined relatively consistently since then, especially since plunging out of overbought territory (below 70%) on January 9th. This steady decline forms the core of my bearish thesis on the S&P 500 (SPY). Today, T2108 took another plunge – this time dropping from 61.4% to 55.2%. This position is the lowest close in over two months and motivated my switch from “cautiously bearish” to “bearish” for the short-term trading call.
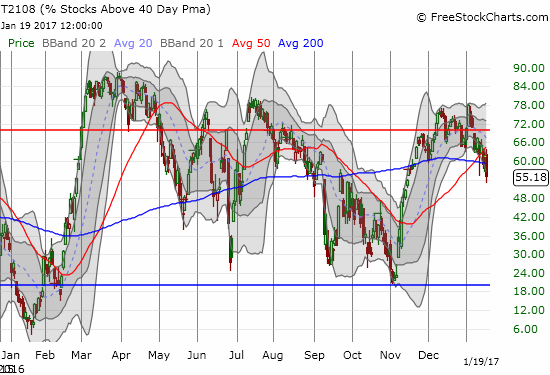
The steady decline in T2108 this year signals bearish winds in the making.
The stock market has so far performed relatively well despite T2108’s steady decline. Yet, T2108 typically wins this kind of bearish divergence. The bearish divergence going into the August 2015 flash crash was the most dramatic example of the resolution of this tension. The S&P 500 still has a marginal gain for the year which includes a fresh all-time high. The Nasdaq (QQQ) has closed with a gain 9 out of the year’s 12 trading days, also including fresh all-time highs. The charts below by themselves hardly scream bearish warnings.
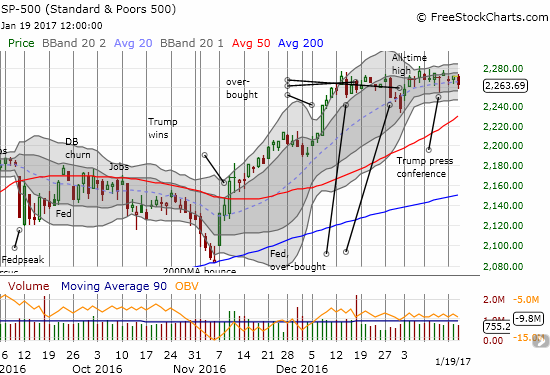
The S&P 500 (SPY) has essentially churned for a month – it even failed to convert a Bollinger Band (BB) squeeze into a big breakout/breakdown.
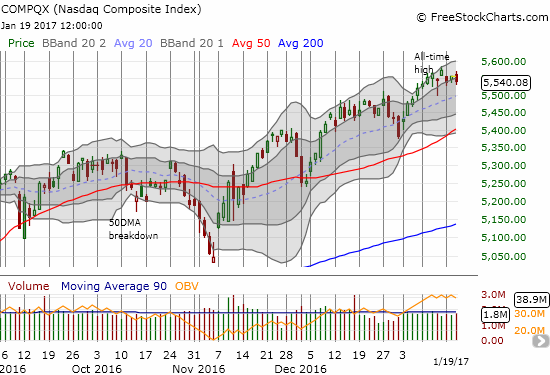
The Nasdaq (QQQ) printed a clear breakout earlier this month and quieted observations that tech was playing second fiddle to industrial and cyclical stocks.
Given the lack of bearish clues in the charts above, I embarked on another search for support of the bearish warnings coming from T2108. It almost appears as if the market is positioning for a major catalyst to come from, or soon after, the inauguration of America’s 45th President: Donald J. Trump.
First culprit: the Financial Select Sector SPDR ETF (XLF). Big banks and financial institutions delivered highly anticipated earnings and failed to give XLF the extra juice it needed to break out from six weeks of churn. XLF is now testing 50DMA support. Note how XLF faded after the first batch of earnings. After Goldman Sachs (GS) reported earnings, XLF suffered its largest one day loss of this entire post-election period.
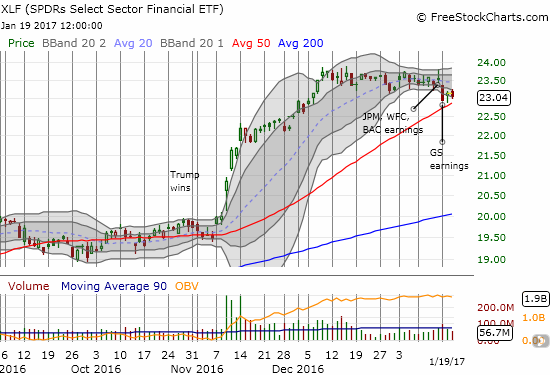
The Financial Select Sector SPDR ETF (XLF) teeters on 50DMA support and looks very “heavy.” Can inauguration somehow save the day and create a fresh spark or will XLF breakdown and confirm the bearish winds blowing about?
Second culprit: The iShares Russell 2000 (IWM). Like XLF, IWM is now testing support at its 50DMA. IWM topped out back on December 9th and has churned slowly but surely lower ever since. IWM is under-performing with a slight year-to-date loss.
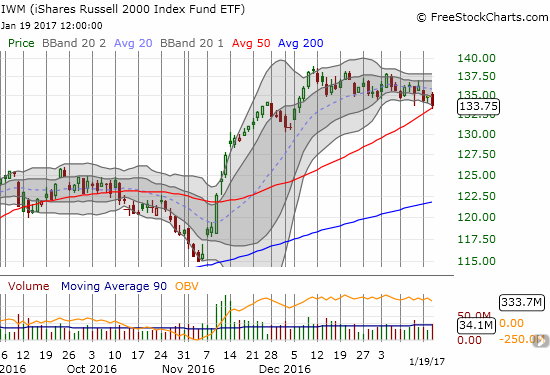
The iShares Russell 2000 (IWM) teeters on support. Like XLF, is IWM looking for encouragement from Donald Trump’s inauguration?
Third culprit: The SPDR S&P Retail ETF (XRT). XRT was an early bearish siren given its steep sell-off going into Christmas. The sell-off slowed down from there as XRT’s 200DMA tried mightily to stave off a major breakdown. That resolve weakened ever so slightly today with a 1.8% loss that closed XRT at its lowest post-election close and below 200DMA support.
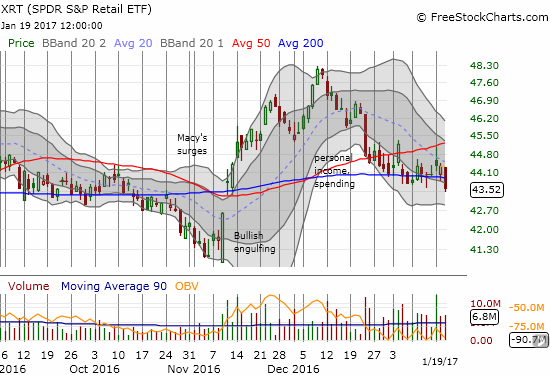
The SPDR S&P Retail ETF (XRT) has churned widely around 200DMA support. Today’s close was XRT’s first official breach into its post-election gap up.
The volatility index, the VIX, is making another run off support from its long-standing lows. However, I cannot get too excited because the VIX is not even at a high for the year.
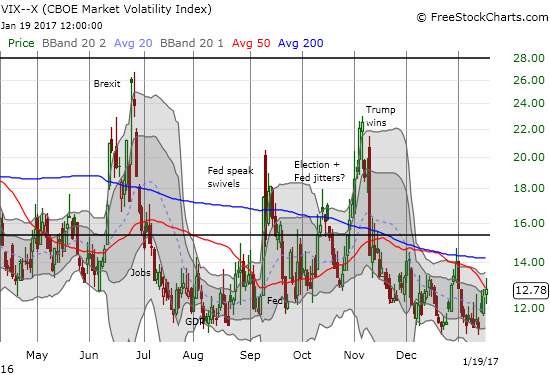
The volatility, VIX, hopped up in anticipation of Trump’s inauguration.
While the weakness in financials, small caps, and retail stocks are important tells, there are pockets of bullishness that no doubt are encouraging more rosy interpretations of the market action.
Tesla Motors (TSLA) has impressed with a convincing follow-through to the breakout I pointed out in an earlier post. Alas, I never got the entry point I wanted so I still sit here TSLA-less (a fortuitous day trade provides me just a semblance of solace). Today’s big move came on the heels of an analyst upgrade, and the end of an investigation by the National Highway Traffic Safety Administration (NHTSA) into the fatal crash of a Tesla Model S while it was running on its Autopilot system.
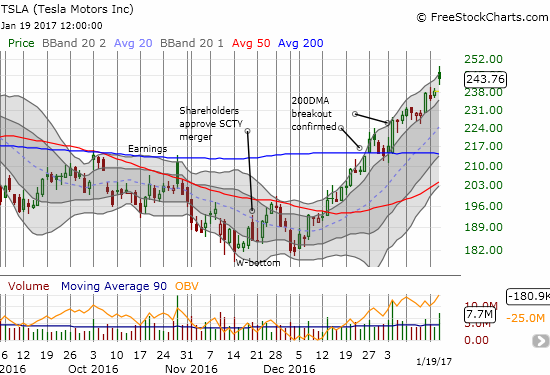
Tesla Motors (TSLA) closed near a 9-month high as it continues to skyrocket upward through its upper-Bollinger Bands (BBs)
And then there is the Australian dollar (FXA). The currency has experienced a revival of sorts. Against the weakening Japanese yen (FXY), AUD/JPY has rallied to its high from last month which was a 52-week high. AUD/JPY is running strong and firmly counter to the bearish signal coming from T2108.
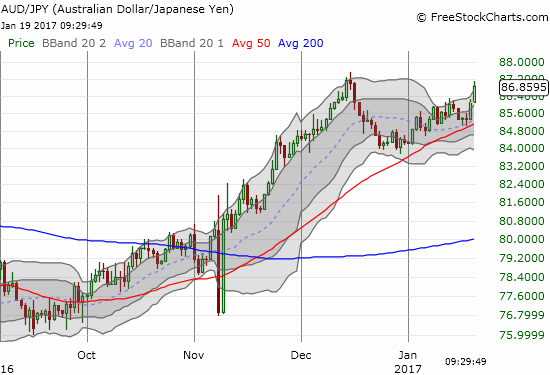
AUD/JPY is in rally mode even as much of the stock market churns lower.
While the commodity-dependent Australian dollar rallies, many commodity-related stocks have done the same. These stocks are enjoying a good 2017 so far after selling off into the close of 2016. Two weeks ago, Freeport-McMoRan, Inc. (FCX) jumped impressively off 200DMA support. FCX followed-through with a confirmation of 50DMA support before cooling down a bit lately.
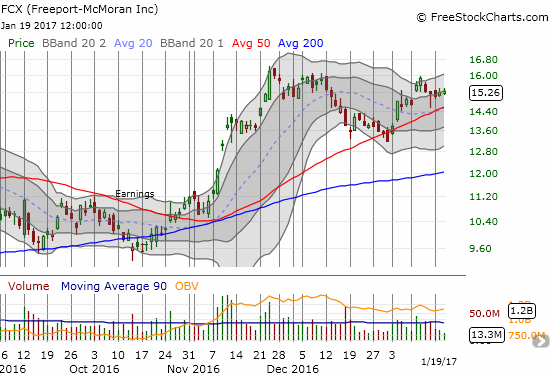
Freeport-McMoRan, Inc. (FCX) is up 15% year-to-date after confirming support at its 50DMA.
Gold is one commodity which has surprised to the upside this year. As one would expect, the SPDR Gold Shares (GLD) sold off after the Fed hiked rates. The bad mood lasted just one more day. GLD is up 4.7% for the year after following its upper-BBs on an orderly path higher. In my last T2108 Update, I recommended a pairs trade going long GLD call options and put options on the iShares 20+ Year Treasury Bond (TLT). I promptly executed the trade on Tuesday as both TLT and GLD gapped higher. After two days, TLT’s quick losses drove a double for my put options doubled with sufficient profit to pay for the call options on GLD. My options trading rules dictate locking in profits on a quick double. I decided to follow that rule although this position is part of a pairs trade. I am inclined to fade future rallies on TLT as long as I hold the GLD call options.
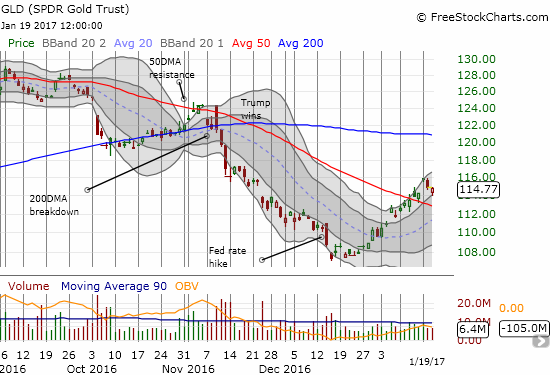
SPDR Gold Shares (GLD) has enjoy a straight shot upward since carving out an 11-month low following the Fed’s rate hike.
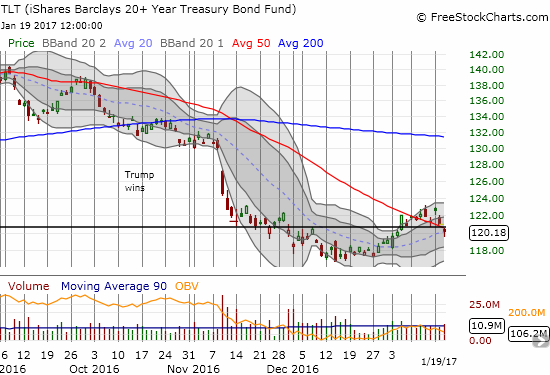
The iShares 20+ Year Treasury Bond (TLT) continues to pivot around 2015’s closing value (the think, solid, black horizontal line). A 50DMA breakout quickly gave way to a 50DMA breakdown. Can the uptrending 20DMA provide support?
Perhaps nothing says “pre-inauguration hold” better than the U.S. dollar index (DXY0). The index is off its 14-year high and pivoting around its uptrending 50DMA support. The 100 level sits tantalizingly below. While Trump’s nominee for Treasury secretary, Steven Mnuchin, clarified Trump’s “weak dollar” comments by saying those words were a short-term reference, I strongly suspect the index will be more “jumpy” than usual once Trump jumps into his inauguration speech. Over the longer-term, I duly note that economists claim the U.S. dollar could soar if Trump is successful in clamping down on imports with higher tariffs.
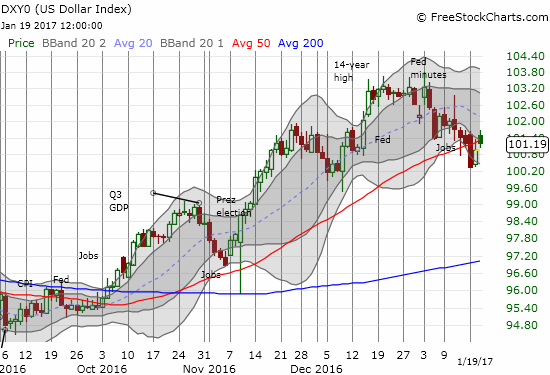
The U.S. dollar index (DXY0) clings to 50DMA support perhaps awaiting its next direction from the inauguration…
In sum, while I am now firmly bearish on the stock market, I have yet to act aggressively on the short-term trading call. I still prefer to wait for some kind of technical confirmation like a 50DMA breakdown for the S&P 500. Moreover, Trump presents the ultimate wildcard: no restraint in public utterances and lack of clarity on which of his most impactful policies will ultimately garner Congressional support. It is a bit like fearing I could get caught like the defense of the Denver Broncos on Christmas Day, 2016. The Kansas City Chiefs lined up a big man in running formation…only to watch in horror as that big man tossed the ball in the air behind the entire defense…
6-3. 346lbs. @PoeMans_dream is a defensive tackle...
— NFL (@NFL) December 26, 2016
And he just threw a TD for the @Chiefs. Yes, really. https://t.co/lSTz7iB5kG
(On December 25, 2016, Dontari Poe became the heaviest player, at 346 pounds, in NFL history to throw a touchdown pass. Earlier in the season, he became the heaviest player to run for a TD!)
Daily T2108 vs the S&P 500

Black line: T2108 (measured on the right); Green line: S&P 500 (for comparative purposes)
Red line: T2108 Overbought (70%); Blue line: T2108 Oversold (20%)
Weekly T2108

Full disclosure: Long SDS, long and short positions on the U.S. dollar, long GLD shares and call options, short AUD/JPY.
Follow Dr. Duru’s commentary ...
more

