
T2108 Update – Finally Overbought, Essentially (Including Chart Reviews Of DE And INTC)
T2108 Status: 69.99%
T2107 Status: 54.6%
VIX Status: 12.1
General (Short-term) Trading Call: Hold (bullish positions)
Active T2108 periods: Day #28 over 20%, Day #26 over 30%, Day #23 over 40%, Day #21 over 50%, Day #16 over 60% (overperiod), Day #98 under 70% (underperiod)
Reference Charts (click for view of last 6 months from Stockcharts.com):
S&P 500 or SPY
SDS (ProShares UltraShort S&P500)
U.S. Dollar Index (volatility index)
EEM (iShares MSCI Emerging Markets)
VIX (volatility index)
VXX (iPath S&P 500 VIX Short-Term Futures ETN)
EWG (iShares MSCI Germany Index Fund)
CAT (Caterpillar).
Commentary
So tantalizing part 2.
Hard to believe, but, yes, T2108 closed at 69.99% today.
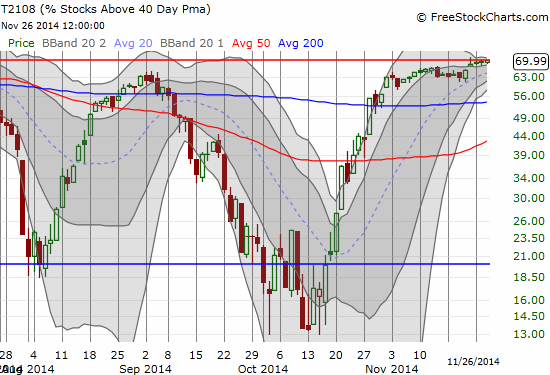
T2108 continues to tease along the overbought threshold
This is a rounding away from 70% and so essentially represents overbought, especially after T2108 first crossed the 70% threshold 3 days ago and scraped along it since. Because my code that calculates historical relationships defines overbought strictly as 70.0% and above, I am not starting the counter just yet. For trading purposes, this milestone of 69.99% is definitely good enough to trade as if T2108 is overbought. Refer to the last T2108 Update for related trading rules.
The S&P 500 closed strong at its high of the day and a new closing all-time high. It did not beat out the intraday high though.
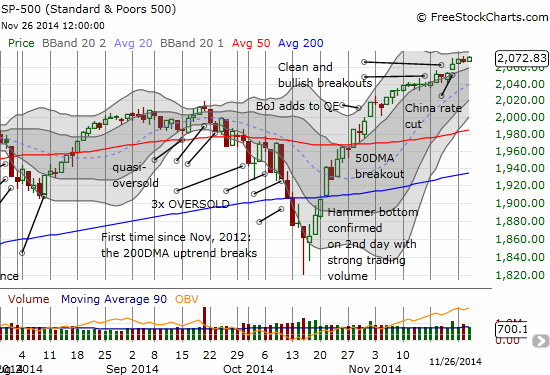
Looks like yet more room to run for the S&P 500
The VIX is continuing its downtrend as it hit 12.1%. Since a major fade from the 15.35 pivot last week, the VIX has been going down in a straight line by steady and nearly equal increments. There is still a short runway to go lower still. I have not shown the destructive impact on ProShares Ultra VIX Short-Term Futures (UVXY) in a while. Too bad I have not focused on put options on UVXY over the past week.
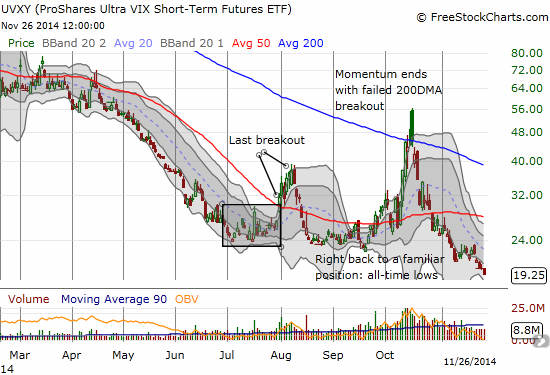
UVXY still knows no bottom
Or maybe I should have just stayed long ProShares Short VIX Short-Term Futures (SVXY):
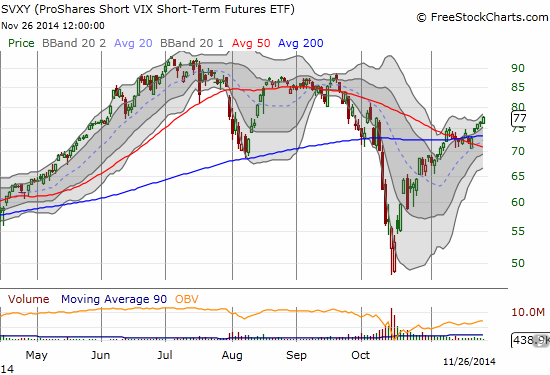
The “right” way to play volatility…although it is very likely to print a lower high soon
Even the Australian dollar (FXA) versus the Japanese yen (JPY) has turned sharply upward. AUD/JPY bounced nicely off the psychologically important 100 level in what is starting to look like a hammer bottom that signals an end to the downward pressure. Good thing I used the opportunity to buy and did not jump on the bearish warning right away.
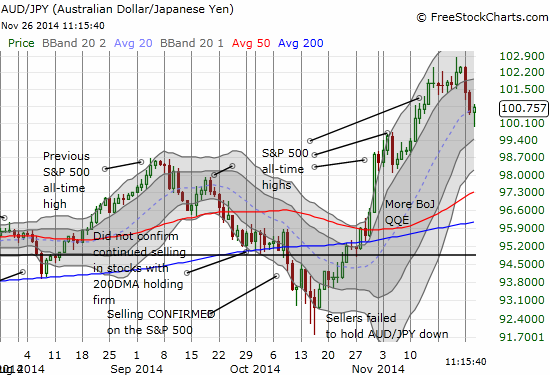
Keeping a close eye on developments with AUD/JPy as it could provide THE key signal for whether the overbought period is short-lived and bearish or long-lived and bullish
Charts of the day go to post-earnings Deere & Company (DE) and post analyst day Intel (INTC).
Deere & Company (DE) remains perfectly trapped between its 50DMA on the low side and its 200DMA on the high side. Earnings did not resolve the stalemate. In fact, it highlighted the stalemate by touching BOTH ends of the range on the day. DE now has my attention, and I am assuming a breakout, whether up or down, will likely be the start of a strong and sustained move in the given direction. Advantage is likely with the bulls given the 50DMA is now sloping upward.
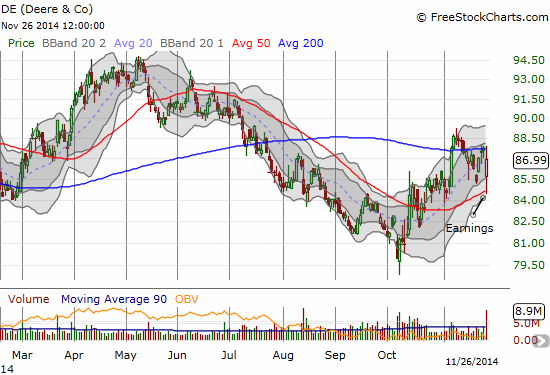
Deere & Company (DE) is on the edge of what could (should) be a major breakout or breakdown
Almost nothing says “bullish stock market” better than Intel (INTC) at or around 14 year highs. Absolutely amazing. ‘Nuff said.
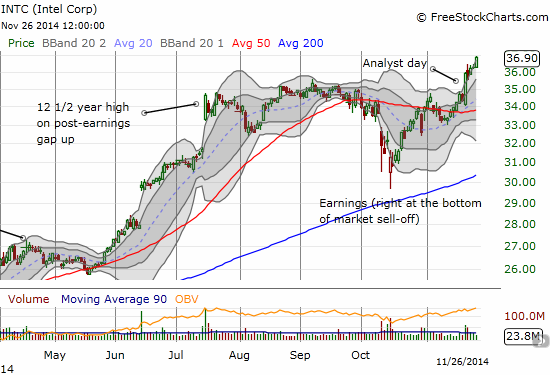
A very bullish run from a post-earnings gap down
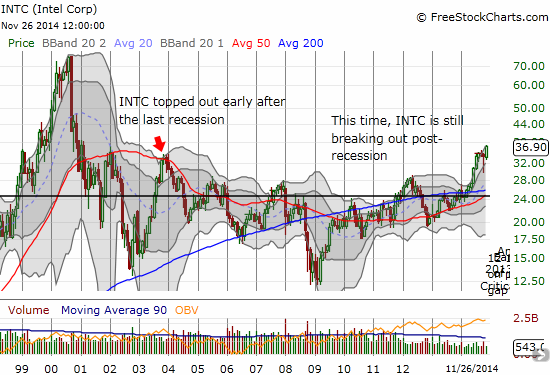
It’s a different Intel this time
My strategy to trade INTC between earnings continues to work very well…except this time I bailed far too early!
Daily T2108 vs the S&P 500

Black line: T2108 (measured on the right); Green line: S&P 500 (for comparative purposes)
Red line: T2108 Overbought (70%); Blue line: T2108 Oversold (20%)
Weekly T2108

*All charts created using freestockcharts.com unless otherwise stated
Disclosure: long SSO shares, long NFLX put spread


