
T2108 Update – Countdown (Again) To Overbought Market Conditions
T2108 Status: 59.1%
T2107 Status: 53.4%
VIX Status: 13.4
General (Short-term) Trading Call: Neutral. No longer fading rallies. The S&P 500 is”close enough” to fresh all-time highs even as T2108 is still 10 percentage points away from overbought.
Active T2108 periods: Day #106 over 20%, Day #65 above 30%, Day #9 above 40%, Day #4 over 50% (overperiod), Day #12 under 60%, Day #176 under 70%
Reference Charts (click for view of last 6 months from Stockcharts.com):
S&P 500 or SPY
SDS (ProShares UltraShort S&P500)
U.S. Dollar Index (volatility index)
EEM (iShares MSCI Emerging Markets)
VIX (volatility index)
VXX (iPath S&P 500 VIX Short-Term Futures ETN)
EWG (iShares MSCI Germany Index Fund)
CAT (Caterpillar).
Commentary
T2108 closed the day at 59.1%. Looking back, T2108 looks like it has nearly steadily marched higher since the last closing low on March 10th. The uptrend is even more clear on the S&P 500 (SPY) although it diverged slightly from T2108 with a marginally lower close. Incredibly, the index has neatly alternated between up and down days on this march higher.
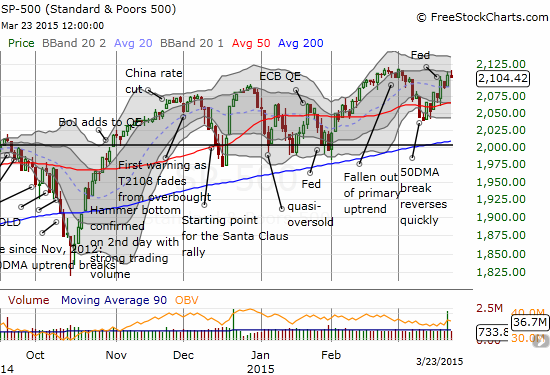
The S&P 500 is stair-stepping back to all-time highs
The volatility index, the VIX, managed a minor gain as it now struggles to hold its 2015 low.
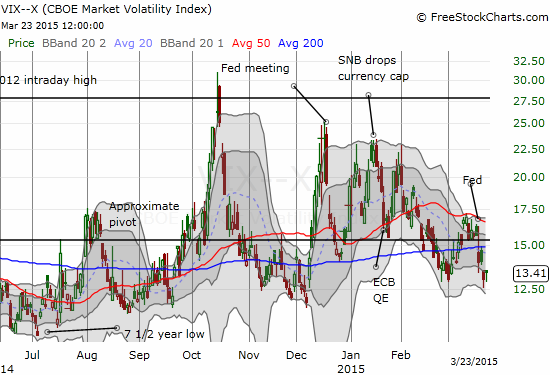
The VIX is on the defensive again
Finally, the Australian dollar (FXA) has conquered 50DMA resistance against the Japanese yen (FXY). At the time of writing AUD/JPY is toying with 2-month highs.
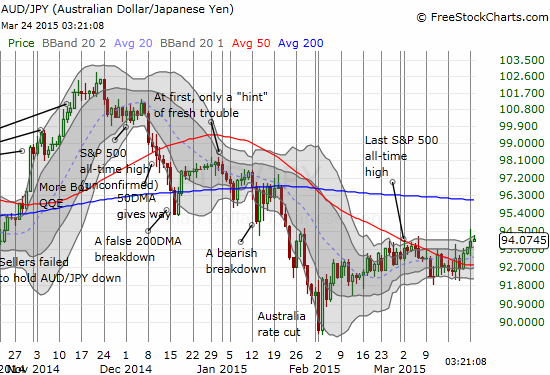
Is the Australian dollar in the early stages of a major relief rally?
Put it all together and the writing on the wall is giving bulls and buyers plenty of reason to continue exhaling sighs of relief from the technical dangers I started noting earlier this month. As a result, I have switched the trading call from bearish to neutral. The S&P 500 is “close enough” to fresh all-time highs. Moreover, T2108 is still 10 percentage points away from overbought; this setup gives the market plenty of room to keep motoring higher. However, I am too cautious to flip to bullish on the overall market here. The neutral rating frees me up to give equal weight to bullish and bearish setups on individual stocks.
Also giving T2108 room to run is the duration over which it has failed to enter overbought territory. T2108 has now gone 176 trading days without going overbought. This is rarefied territory from the historical record (going back to 1986). The chart below shows we can count on one hand the number of times T2108 has avoided overbought territory for a longer duration. The chart also suggests that the S&P 500 should deliver about 8% in gains by the time T2108 flips to overbought territory. The last overbought day was July 3, 2104. The S&P 500 is up 6.0% since then.
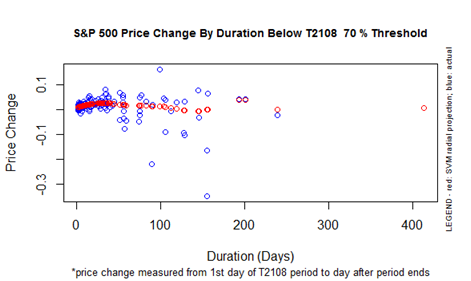
The duration of the current T2108 70% underperiod is exceptionally long compared to the historical record
T2108 has also spent 106 days above oversold territory. The historical record suggests T2108 and the S&P 500 are at a critical juncture here. The projections below show a steady ramp in expected performance from here to the time T2108 ends the 20% overperiod. The S&P 500 was last oversold on October 16, 2014. The S&P 500 is up 11.5% since then. To hold onto this gain by the next oversold period, T2108 will need to stay above oversold territory for around 100 more trading days. Such an achievement will require a healthy extension of the current rally. T2108 can also align with historic behavior by trading all the way back to oversold territory over the next few weeks. Not likely…
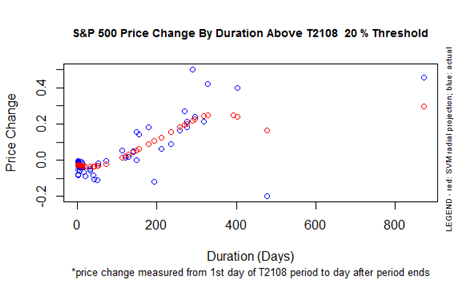
S&P 500 Price Change By Duration ABOVE T2108 Threshold 20%
Here are some charts to occupy the time until T2108 reaches its next milestone.
Intercept Pharmaceuticals, Inc. (ICPT)
Buy the rumor, sell the news? That seems to be the case for Intercept Pharmaceuticals, Inc. (ICPT). Buyers of the secondary stock offering have made surprisingly easy money. Perhaps they are finally locking in profits after the company announced results of a drug trial. Note the consistency of the post-news selling in ICPT (I may have missed a few other important news evets).
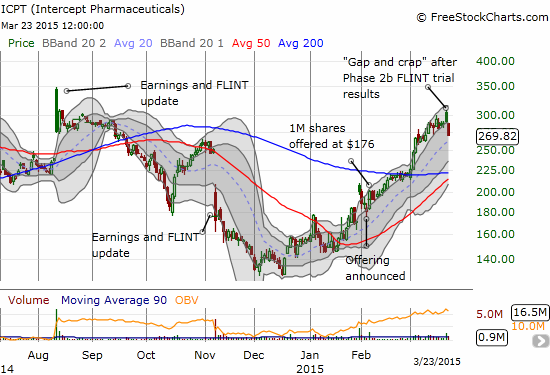
Time for ICPT to cool off?
iShares Nasdaq Biotechnology (IBB)
It is very possible that ICPT is suffering more from a general industry pullback than anything company-specific. The biotech ETF, iShares Nasdaq Biotechnology (IBB), has been on an absolute tear. IBB is up about 500% since the March, 2009 lows. It is up about 243% since the end of 2011. It is already up 18% year-to-date. On Friday, IBB “gapped and crapped” along with ICPT. It also followed-through with high-volume selling on Monday, just like ICPT. The bio-tech sector now has a lot more of my attention!
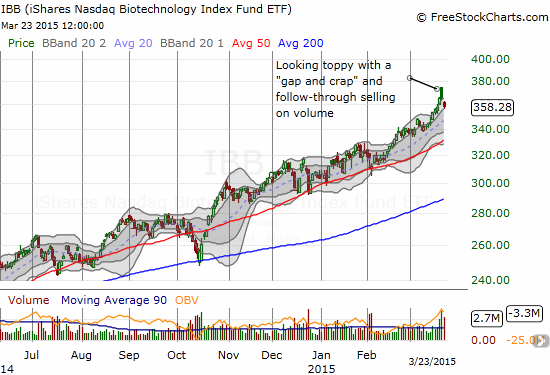
A VERY consistent and very strong uptrend may be taking a pause here…
Coach (COH)
In an earlier post, I promised to buy Coach (COH) when I was felling more bullish. I think flipping from bearish to neutral is close enough. Last week, I bought the dip that seems to have conveniently found support at the lower part of the first Bollinger Band (BB).
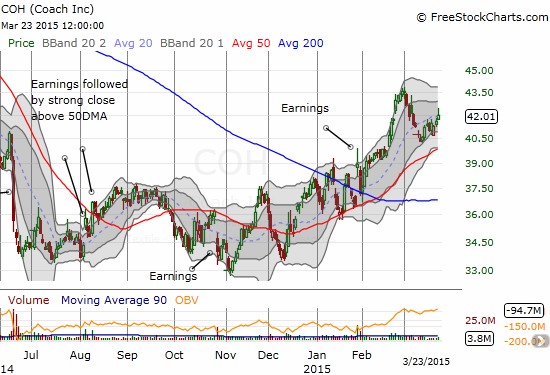
Coach (COH) continues to maintain an uptrend from its recent lows that is following the 50DMA with multiple dip-buying opportunities along the way
Facebook (FB)
Last week, Venture capitalist Bill Gurley made a lot of noise about Facebook (FB) and the risk it faces in the new fearless Silicon Valley. He is particularly worried about a “risk bubble” expressed in the rapid growth of mobile app install ads. So of course, in response, FB bounced neatly off 50DMA support and soared to new all-time highs. FB has now invalidated what looked like a triple top.
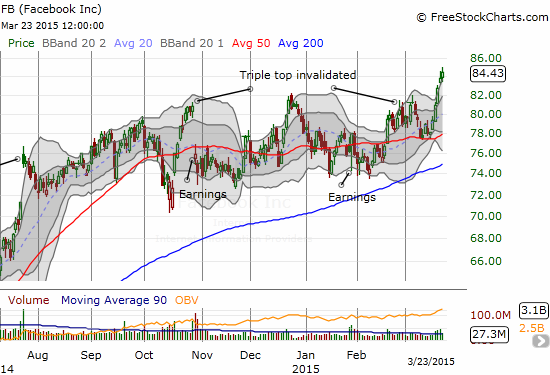
Facebook achieves new all-time highs
iShares MSCI Germany (EWG)
The breakout for iShares MSCI Germany (EWG) above its 200DMA continues, albeit in choppy form. I continue to like EWG as the best play on an eventual comeback for Europe. Regardless, I am trying to get more disciplined about buying 200DMA breakouts as they tend to usher sustained and extended rallies.
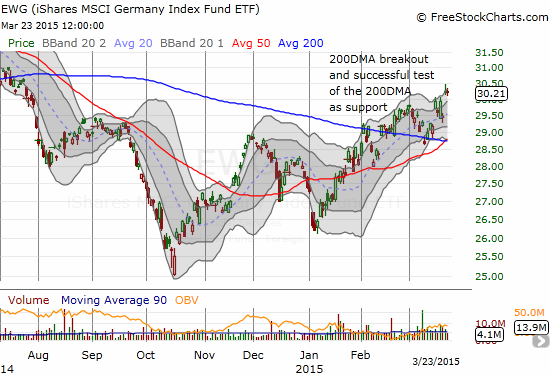
The breakout continues for iShares MSCI Germany (EWG). It is now at 8-month highs.
Baidu, Inc. (BIDU)
I expressed hestinacy last week about buying back into the Baidu, Inc. (BIDU) move. The stock is already working to reassure me with a fresh post-earnings closing high and a push above 50 and 200DMA resistance.
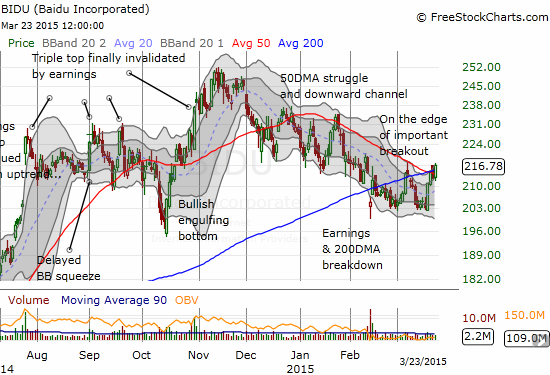
Baidu is still trying to repair the damage from earnings over a month ago
Daily T2108 vs the S&P 500

Black line: T2108 (measured on the right); Green line: S&P 500 (for comparative purposes)
Red line: T2108 Overbought (70%); Blue line: T2108 Oversold (20%)
Weekly T2108

*All charts created using freestockcharts.com unless otherwise stated
Be careful out there!
Full disclosure: long EWG call options; short FB shares, long put spread, and long call options; short ICPT, long call options; long COH call options; ...
more

