
T2108 Update – A Surprising Bearish Divergence For The S&P 500
(T2108 measures the percentage of stocks trading above their respective 40-day moving averages [DMAs]. It helps to identify extremes in market sentiment that are likely to reverse. To learn more about it, see my T2108 Resource Page. You can follow real-time T2108 commentary on twitter using the #T2108 hashtag. T2108-related trades and other trades are occasionally posted on twitter using the #120trade hashtag. T2107 measures the percentage of stocks trading above their respective 200DMAs)
T2108 Status: 70.8% (overbought day #3)
T2107 Status: 66.8%
VIX Status: 11.3
General (Short-term) Trading Call: cautiously bearish
Active T2108 periods: Day #220 over 20%, Day #40 over 30%, Day #39 over 40%, Day #37 over 50%, Day #31 over 60%, Day #3 over 70%
Commentary
The big resolution of the Bollinger Band (BB) squeeze on the S&P 500 (SPY) came on the heels of the report on U.S. jobs for December.
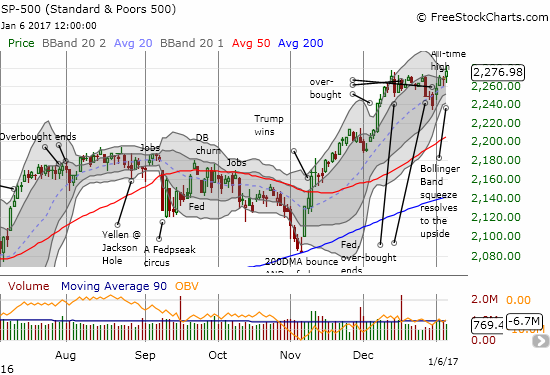
The S&P 500 broke out of a Bollinger Band (BB) squeeze and printed a new all-time high.
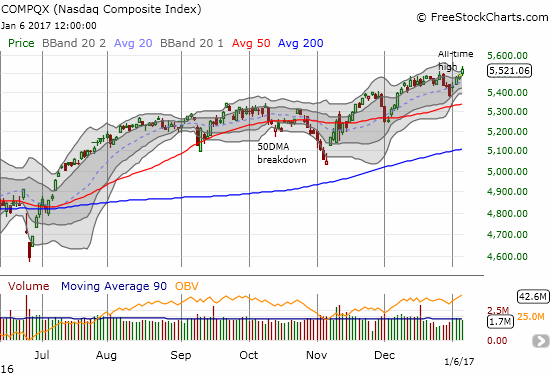
The Nasdaq made an even clearer breakout by stretching above its upper-BB.
I described the importance and mechanics of the BB-squeeze in the January 3rd update and further emphasized its importance in the last T2108 Update. The resolution of the BB-squeeze was to the upside. As a result, per plan, I was supposed to flip the short-term trading call to (cautiously?) bullish. Yet, a very surprising bearish divergence emerged that forced me to apply the brakes. In fact, the divergence is so surprising that I have a nagging doubt about its accuracy. My favorite technical indicator, T2108, the percentage of stocks trading above their respective 40-day moving averages (DMAs), fell so sharply on the day that it almost ended the current overbought period with a 70.8% close.
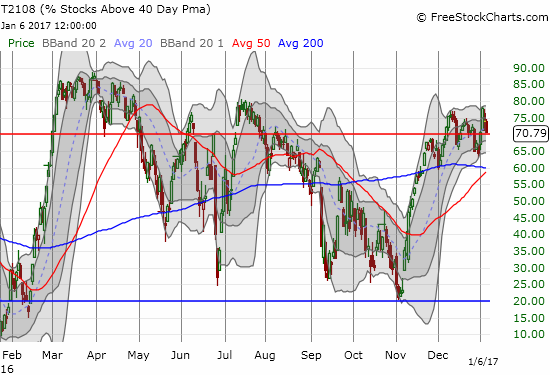
T2108 almost fell below the 70% threshold for overbought conditions.
So instead of planning for a change in trading strategy, I spent some time for this post trying to identify the source(s) of this bearish divergence. The bottom line: there must have been a good number of stocks sitting at the edge of their 40DMAs, especially among retail stocks and small caps. If so, then it makes sense to take a cautious approach to interpreting moves in and out of overbought conditions in the absence of definitive and convincing supporting signals.
I first looked at the split between the extremes of the low volatility and high beta components of the S&P 500. PowerShares S&P 500 Low Volatility ETF (SPLV) was essentially flat on the day. PowerShares S&P 500 High Beta ETF (SPHB) was also essentially flat. Both indices gained 0.2% which was below the S&P 500’s 0.4% gain on the day. Yet, since neither index fell, I cannot use them to explain the bearish divergence. The charts below indicate that neither index can help explain the S&P 500’s breakout to new all-time highs either. As a reminder, SPLV consists of the 100 stocks from the S&P 500 with the lowest realized volatility over the past 12 months. SPHB consists of the 100 stocks from the S&P 500 with the highest beta over the past 12 months.
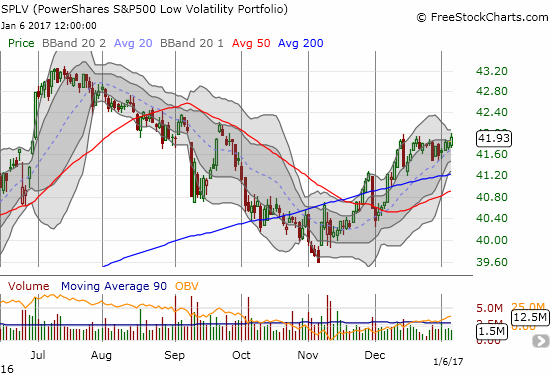
PowerShares S&P 500 Low Volatility ETF did not quite break out of recent consolidation as its BB squeeze still takes shape.
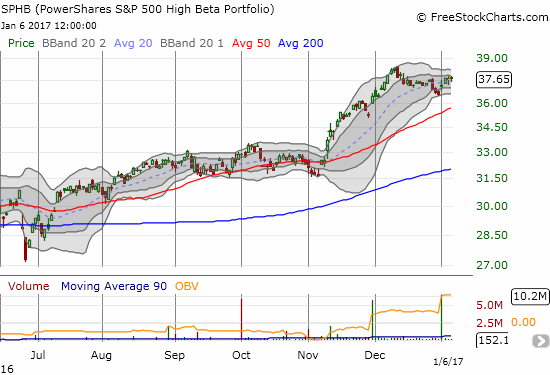
PowerShares S&P 500 High Beta ETF remains off its recent high.
Financial stocks have been big winners in the post-election rally and the “Trumpflation” trade. Like the S&P 500, the Financial Select Sector SPDR ETF (XLF) gained just a fraction of a percent (extending out a decimal, the gains were nearly identical – 0.35% versus 0.34% respectively). While XLF kept pace, the ETF did not break out from its now month-long consolidation. Regardless, XLF does not seem to be contributing to any bearish divergence.
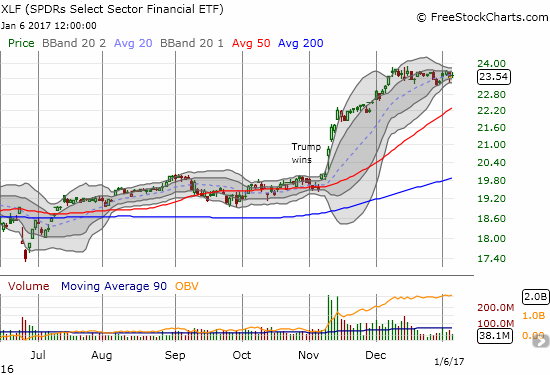
The Financial Select Sector SPDR ETF remains stuck in a month-long consolidation.
Small-caps made a key transformation alongside the election. The iShares Russell 2000 (IWM) immediately flipped from a leading bearish indicator to a confirmation of the switch to a bullish tone. Like XLF, IWM remains stuck in a month-long consolidation period. Unlike XLF and SPY, IWM fell a fraction (-0.4%) on the day. Thus, IWM is a likely source of the bearish divergence in T2108.
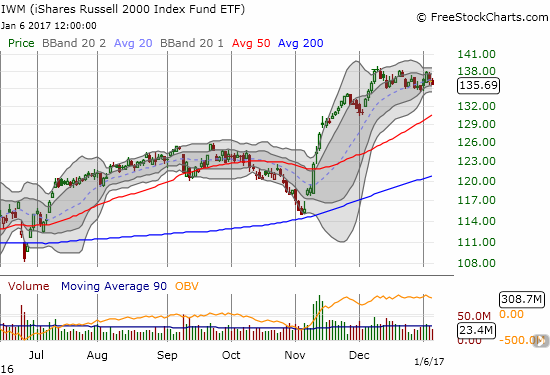
Within a small window of consolidation, in 2 days iShares Russell 2000 fell from the top of its range toward the bottom.
In the last T2108 Update, I pointed out how SPDR S&P Retail ETF (XRT) bounced off critical support and through important resistance just ahead of a major shock form individual retailers. XRT managed to hold 200DMA support in the subsequent selling but broke through to close the week. With a 0.7% drop, XRT can easily provide a source of the bearish divergence.
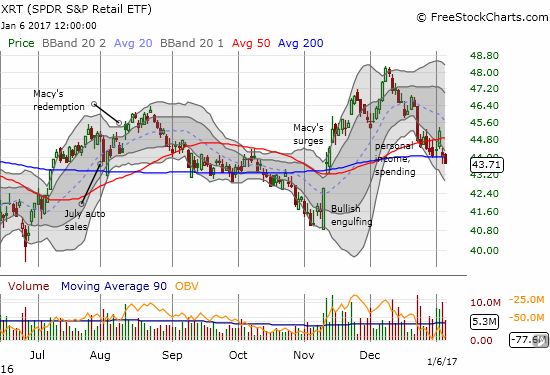
The 200DMA breakdown for SPDR S&P Retail ETF has almost erased all of the index’s incremental post-election gains. A gap fill is certainly in play now.
Given this ominous 200DMA breakdown, I decided to find a retailer to short that has yet to receive big headlines. Best Buy (BBY) looked like a decent choice. The electronics giants has been selling off since mid-December (contrary to the expectations for a Santa Claus rally) and broke through 50DMA support to close 2016. Interestingly, BBY did not receive much of a boost in the immediate wake of the election. Investors and traders stayed disciplined by waiting for earnings for confirmation of good news. Unfortunately, the recent selling has reversed all of the incremental post-earnings gains and a gap-fill is now in play. If retailers are generally in trouble, BBY could and should fall all the way to a 200DMA retest.
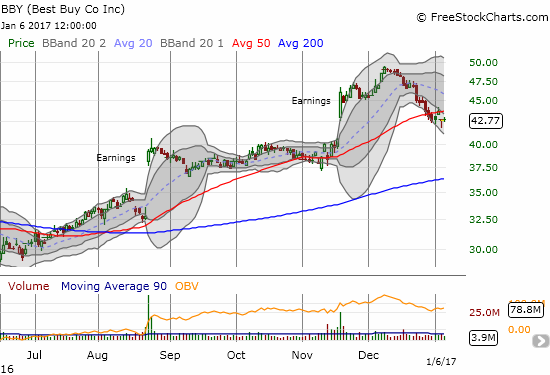
Best Buy marginally confirmed its 50DMA breakdown.
Amazon.com (AMZN) is once again getting the blame for the woes of specific retailers. BBY has fought well against AMZN in recent years, but I imagine the war of attrition will take its toll once again. AMZN is among the top 10 holdings in XRT (which actually includes some heavy hitters) and is no doubt preventing XRT from looking even worse. AMZN broke through 50DMA resistance on Thursday and confirmed that breakout with an impressive 2.0% gain on Friday. The 2-day surge came on heavy trading volume. If the bearish divergence is about sagging small-caps and the woes of individual retailers, then AMZN’s surge can help explain how the S&P 500 (and the Nasdaq) managed to print all-time highs amid selling elsewhere.
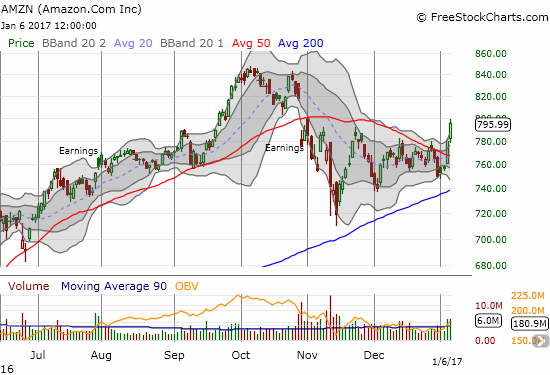
Amazon.com confirmed a 50DMA breakout in impressive fashion.
Indeed, the entire FANG complex – Facebook (FB), Amazon.com, Netflix (NFLX), and Google (now Alphabet) (GOOG) – put on quite a show to start the year and end the week. NFLX scored a new all-time high on Thursday although it pulled back slightly on Friday. GOOG gained every day of the week and now sits just below its all-time high. FB is of particular interest because I had to note that the stock’s surge effectively invalidated the breakdown I pointed out last month.
$FB on verge of invalidating breakdown I fingered in Dec. Now breaking from >50DMA & wedge https://t.co/6oYls59Pgt pic.twitter.com/5yvTx3M3co
— Dr. Duru (@DrDuru) January 6, 2017
Here is the chart for FB after closing. Note that FB broke out from converged 50/200DMA resistance.
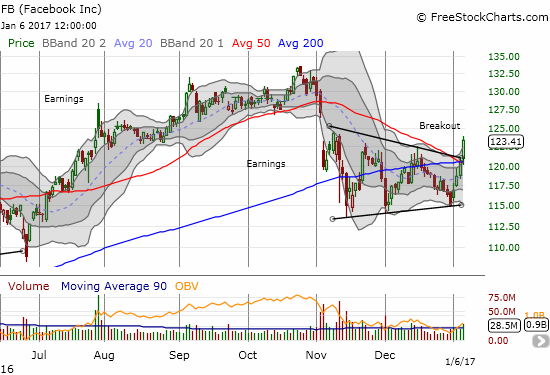
Facebook ended its breakdown pattern with an impressive breakout from what looked like a bearish wedge.
So I find myself conflicted on my short-term trading call: I have trading rules and plans pointing in completely opposite directions – a rare setup! On the one hand, the breakouts for the likes of AMZN and FB are bullish and should be bought. The breakout to a fresh all-time high on the S&P 500 on overbought conditions should be bought.
On the other hand, if the bearish divergence is real, then these moves will not last long. The good news is that this conundrum can be traded using hedged plays. I plan to get back on board the bull train with FB and perhaps AMZN this week. I am keeping the put options on BBY and will likely expand to bearish bets on XRT. I still have a small holding of ProShares UltraShort S&P500 (SDS). I will add to the bearish bet on the S&P 500 with SPY put options IF the index drops below Friday’s low on the index of 2264. In the meantime, I am holding my short-term trading call at cautiously bearish in deference to the bearish divergence.
Oh yeah – the extremely low level of the volatility index, the VIX, requires caution. The VIX is back to a low in place since last summer and a level that has tended to precede higher levels of volatility. Recall that it was 2014 when the VIX hit a new 7 1/2 year low when it cracked just below 11.
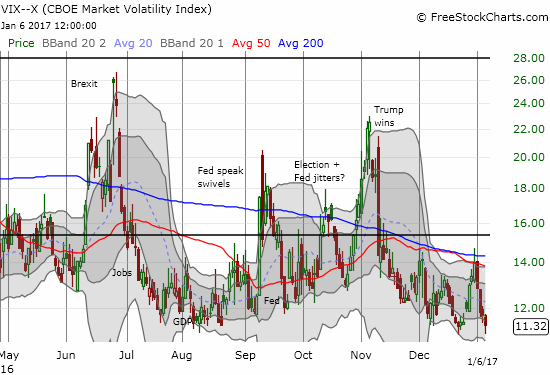
Has the VIX dropped as low as it can go for this cycle?
Finally, the currency market continues to roil with indecision over the U.S. dollar index (DXY0). The jobs report for December brought renewed confidence in the U.S. dollar amid higher bond yields. The iShares 20+ Year Treasury Bond (TLT) failed perfectly at 50DMA resistance. The dollar recovered most of its loss from the previous day. With its 50DMA rapidly uptrending, the dollar index is coming up against a critical test that will not likely allow it to simply spin in a consolidation pattern for long. Stay tuned.
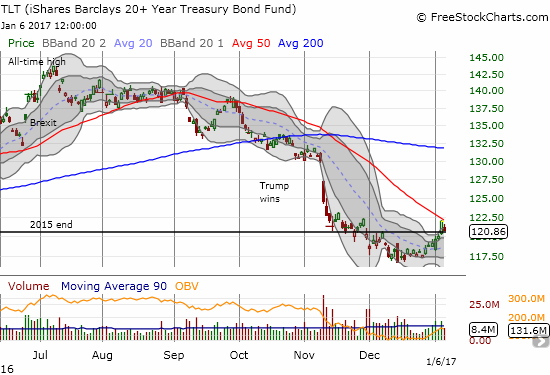
The iShares 20+ Year Treasury Bond ended its relief rally at the brick wall of 50DMA resistance.
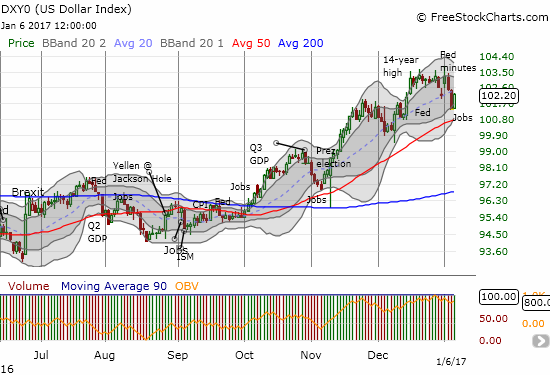
The U.S. dollar index rallied in the wake of the U.S. jobs report for December. Is it signaling a willingness to hold 50DMA support?
Daily T2108 vs the S&P 500

Black line: T2108 (measured on the right); Green line: S&P 500 (for comparative purposes)
Red line: T2108 Overbought (70%); Blue line: T2108 Oversold (20%)
Weekly T2108

*All charts created using freestockcharts.com unless otherwise stated
The charts above are the my latest updates independent of the date of this given T2108 post. For my latest T2108 post click here.
Related links: The T2108 Resource Page
Full disclosure: long SDS, long and short positions on the U.S. dollar, long BBY put options.
Follow Dr. Duru’s commentary on financial markets ...
more

