
T2108 Update – A Long Overdue Close In Oversold Conditions (And How To Trade It)
T2108 Status: 17.9% (low of the day at 16.7%)
T2107 Status: 40.0% (2-year low)
VIX Status: 16.7 (high of the day at 17.6)
General (Short-term) Trading Call: Close out shorts, aggressive traders start buying
Active T2108 periods: Day #1 under 20% (1 day in oversold conditions, ending 319 days over 20% which included day #280 at 20.03%, and day #318 low at 20.25%), Day #7 under 30%, Day #13 under 40%, Day #15 under 50%, Day #17 under 60%, Day #59 under 70%
Reference Charts (click for view of last 6 months from Stockcharts.com):
S&P 500 or SPY
SDS (ProShares UltraShort S&P500)
U.S. Dollar Index (volatility index)
EEM (iShares MSCI Emerging Markets)
VIX (volatility index)
VXX (iPath S&P 500 VIX Short-Term Futures ETN)
EWG (iShares MSCI Germany Index Fund)
CAT (Caterpillar).
Commentary
I always assume that the first trading day of a month is weighted in favor of buyers and bulls. NOT today, not this month.
For the first time since June, 2013, T2108 FINALLY closed in oversold conditions (below 20%). This could be a watershed moment for the stock market, especially since the resulting 50DMA breakdowns on the S&P 500 SPY and the NASDAQ QQQ both confirm topping patterns that I have periodically referenced for both indices. Let’s step through the key charts first.
The S&P 500 lost 1.3% as it pulled away from a now failed test of 50DMA support. The index is now over-stretched well-below the lower-Bollinger Band (BB). Note that the S&P 500 traded below the lower-BB six times during the July/August pullback before hitting a bottom.
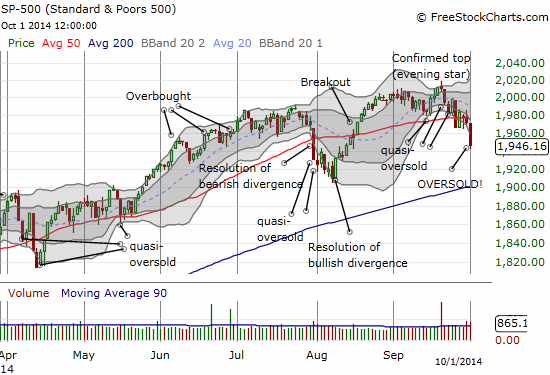
The S&P 500 breaks down below its 50DMA and confirms a top in the form of an “evening star”
The NASDAQ QQQ lost 1.6% as it too pulled away from a now failed test of 50DMA support. The index is now in the uncommon position of being well stretched below its lower-BB.
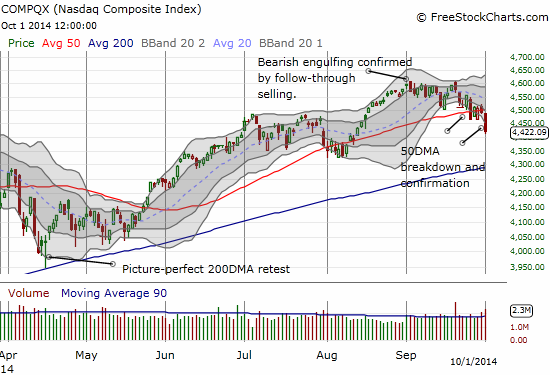
The NASDAQ breaks down below its 50DMA and confirms a top in the form of a “bearish engulfing” pattern
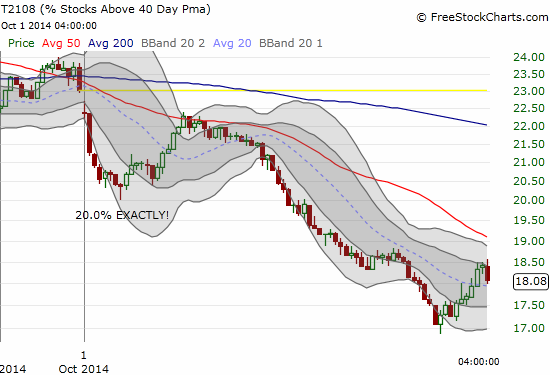
The result is a large drop in T2108 to FINALLY close in oversold conditions. The intraday chart shows how T2108 first nailed 20.0% EXACTLY before attempting a bounce. You just cannot make this stuff up. I would have fallen out my proverbial chair if T2108 had managed yet another close just a hair above the 20% threshold.
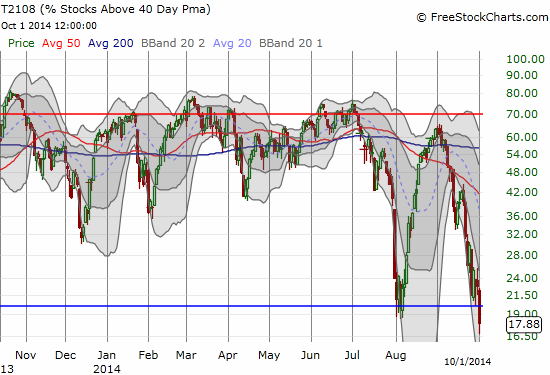
T2108 FINALLY oversold on a close
An attempt to bounce away from oversold conditions soon fails in a big way
T2107, the percentage of stocks trading above their respective 200DMAs, is now at levels unseen for two years. Market participants are now looking at a LOT of their stocks sitting below very critical technical levels. This represents a major test of bullish resolve.
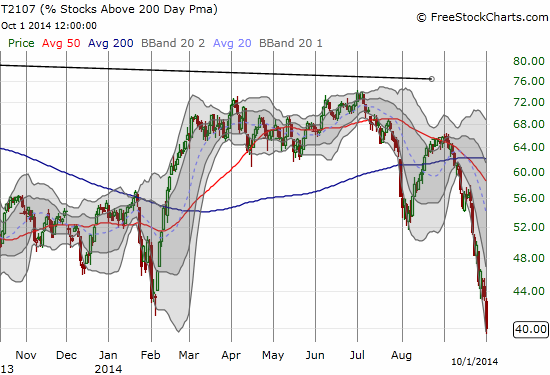
T2107 plunges to levels unseen for two years
The volatility index, the VIX, surged, but it actually faded from highs and thus failed to take out the highs of the last pullback in July/August.
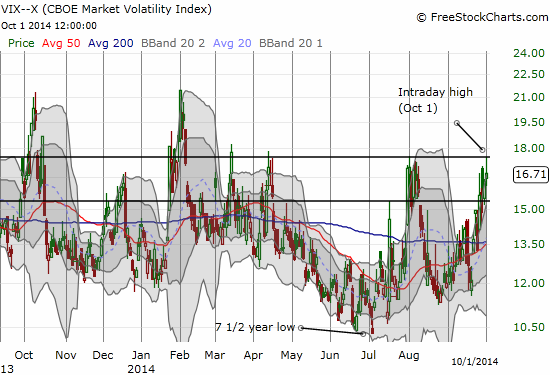
The volatility index fails at resistance from the highs of the last stock market pullback
Putting the picture altogether, the pullback was severe relative to the Bollinger Band but not severe relative to earlier surges in the volatility index. Moreover, the percentage losses on the market indices are not large by any means. My first read is that the next bounce will likely be weak and fail to generate enough momentum to break through 50DMA resistance.
HOWEVER, when I look to the currency markets for guidance, I see that my favorite indicator, the Australian dollar versus the Japanese yen (AUD/JPY) has been holding firm at 200DMA support. This is a bullish divergence. Note well how AUD/JPY held 200DMA support when the S&P 500 found a bottom in August.
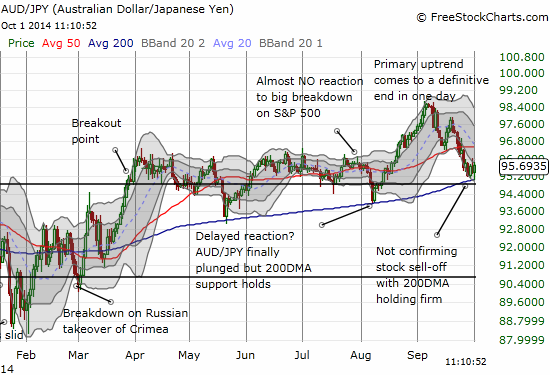
The Australian dollar is holding firm against the Japanese yen despite a global sell-off in stocks
If this support breaks, I will get a lot more bearish (like fade strength kind of bearish and NOT chase weakness kind of bearish).
Notably, my favorite bulldozer in the coal mine, Caterpillar CAT, has confirmed a breakdown from the 200DMA and has no “natural” support levels nearby. Support at $95 from the March lows will likely prove to be weak. Stronger support awaits around $86 where CAT sharply, yet briefly, broke down. As I have noted earlier, CAT is printing a classic pattern of a breakdown and new downtrend in the making.
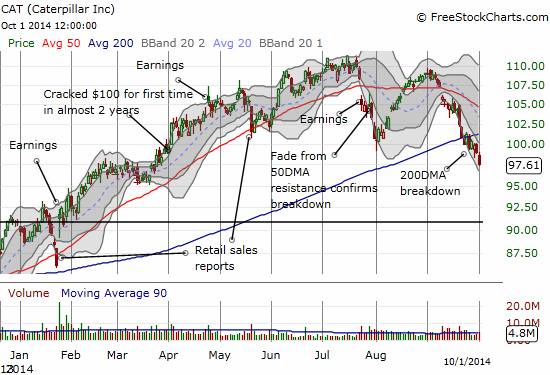
No sign of a bottom anywhere close for Caterpillar
This picture is mixed enough to warrant plenty of caution. In particular, the VIX is not demonstrating enough fear. But for aggressive traders, the T2108 rules still allow for accumulation. Accumulation gets most aggressive once/if the VIX surges past the last high. More conservative buyers can wait for T2108 to end oversold conditions. The big caution there is that such an end may occur very close to 50DMA resistance. Either way, this is a time for bears to start closing out some short positions and taking profits. I closed out a bunch of put options but no short positions yet. I do not have time to go into details on trades, but, basically, all of the bearish chart patterns I have pointed out in the past two weeks or so have paid off well. You can click on the T2108 tag to see a sample.
Given the clock is ticking on selling pressure based on the T2108 30% underperiod, I started slowly into ProShares Ultra S&P500 SSO call options on Tuesday (September 30). I was also motivated by the possibility of a start-of-the-month surge. I accumulated more call options on today’s big swoon. Neither trade was technically within the T2108 trading rules, so I kept the overall position small. I am now in T2108 oversold trading mode and will be following the above-mentioned rules for aggressive traders. I am also ready to buy SSO shares outright to wait out potential churn in the oversold period. Regardless, my current operating assumption is that I should be prepared to bail on my positions on the next test of 50DMA resistance (I will cross that bridge when the market gets there).
Next, let’s see where the S&P 500 performance fell relative to historical periods outside oversold conditions. The incredible 319 days above the 20% oversold threshold places this period in rarefied company.
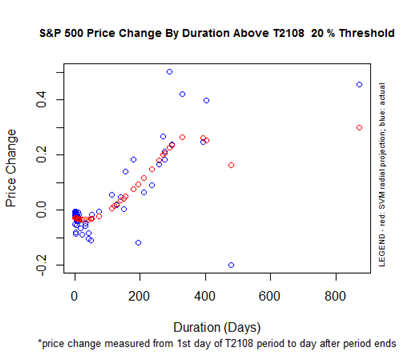
S&P 500 Performance By T2108 Duration Above the 20% Threshold
Incredibly, the 20% “overperiod” ended just as the projected S&P 500 performance peaks around 27% (see the red, open circles). This chart shows that this is the maximum performance we should EVER expect out of the S&P 500 between oversold trading conditions. Oversold conditions last ended on June 26th. The S&P 500 closed at 1603.26 that day. The S&P 500’s close at 1946.16 means that this extended overperiod delivered a 21% performance. This is pretty close, especially given the implied error shown by the chart above.
As a reminder, here is the chart showing the median and average times to expect for T2108 underperiods.
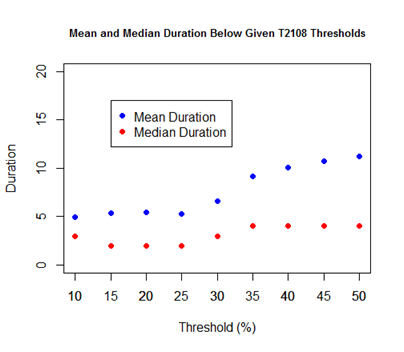
Mean and Median Duration Below Given T2108 Threshold
T2108 spends an average of 5 to 6 days in oversold conditions. The median is a mere 2 to 3 days. The 30% underperiod is already 7 days old. The clock is ticking…
Daily T2108 vs the S&P 500

Black line: T2108 (measured on the right); Green line: S&P 500 (for comparative purposes)
Red line: T2108 Overbought (70%); Blue line: T2108 Oversold (20%)
Weekly T2108

*All charts created using freestockcharts.com unless otherwise stated
Disclosure: Net short the Australian dollar.


