
T2108 Update – A Gut-Check On Sentiment As The S&P 500 Rolls On
(T2108 measures the percentage of stocks trading above their respective 40-day moving averages [DMAs]. It helps to identify extremes in market sentiment that are likely to reverse. To learn more about it, see my T2108 Resource Page. You can follow real-time T2108 commentary on twitter using the #T2108 hashtag. T2108-related trades and other trades are posted on twitter using the #120trade hashtag)
T2108 Status: 53.8%
VIX Status: 12.2%
General (Short-term) Trading Call: Hold
Active T2108 periods: Day #291 over 20% (includes day #280 at 20.01%), Day #5 over 40%, Day #3 over 50% (overperiod), Day #30 under 60%, Day #31 under 70%
Reference Charts (click for view of last 6 months from Stockcharts.com):
S&P 500 or SPY
SDS (ProShares UltraShort S&P500)
U.S. Dollar Index (volatility index)
EEM (iShares MSCI Emerging Markets)
VIX (volatility index)
VXX (iPath S&P 500 VIX Short-Term Futures ETN)
EWG (iShares MSCI Germany Index Fund)
CAT (Caterpillar).
Commentary
“The leaders of the European Union, Ukraine and Russia will meet in Minsk on August 26 to discuss energy security and the conflict in east Ukraine, Ukraine’s President Petro Poroshenko said on Tuesday.” – from Reuters, August 19, 2014.
This quote pretty much ended most headline risks from the crisis in Ukraine. Sure there will be setbacks and bad headlines to come, but this quote seems to establish that the process of resolution is truly underway. The market will now tend to look over the horizon for the prospects of that resolution. This headline then is probably a lot more powerful than the one last Friday (August 15) that sent the market hurtling downward for a brief spell, giving bears one more hope that a substantial correction was finally on the way.
I do not say this to bask in complacency. After all, I was bracing for much more volatility in the next two months and a high potential for a notable drawdown in the market. I make the above point because it is important for understanding sentiment and thus the technicals going forward. To get lower prices in the near-term, something has to happen even worse than the prospect of a Russian invasion of Ukraine. This is no different than all the other crises and particularly geo-political jolts the market has weathered since the financial crisis.
It was another strong day for the S&P 500 (SPY). For the fourth trading day out of the last five, the index closed at or near its high of the day. Since the resolution of a bullish divergence, the index has printed healthy gains on six of the last eight trading days. The chart below shows that the S&P 500 is within inches of setting fresh all-time highs…and this time there is plenty of upside room with the Bollinger Bands (BBs) wide open.
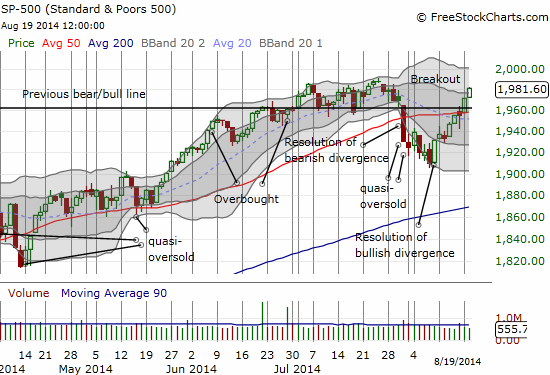
The S&P 500 continues its surge out of oversold conditions
T2108 followed along with the program by closing on its high at 53.8%. T2108 was last at this level July 23rd, right where the S&P 500 peaked before the last bout of selling. Closing above this level will accomplish another bullish confirmation of the upward move.
Since I am always good for caveats and caution, here is one I found from my old mentor Trader Mike.
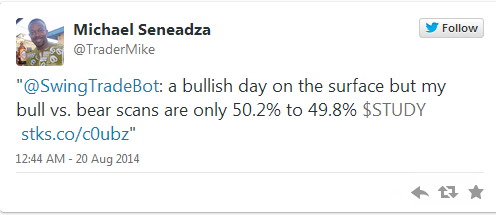
I am assuming that I should expect momentum to slow here, perhaps the S&P 500 even moves to retest the 50DMA as support. This is probably a good time to close out my call options on ProShares Ultra S&P500 (SSO). I was quite aggressive when the S&P 500 first broke above its 50DMA, and there is no need to get greedy considering my full spectrum of positions. If I am fortunate, the market will deliver a gap up Wednesday morning…
While I have been much more confident on the S&P 500, I remain conflicted on ProShares Ultra VIX Short-Term Futures (UVXY). UVXY closed at a new (marginal) all-time low, and I find myself wishing I just owned put options as I used to do before the July consolidation and then breakout got me playing shares on the long side again. But I have also found the shares to serve a good psychological purpose as a hedge to bolster the forward-looking confidence. Stay tuned on this one.
Finally, the NASDAQ (QQQ) continues to streak higher in a straight line to fresh 14-year highs. And remember all that against about small-caps? iShares Russell 2000 (IWM) is finally breaking out its shell with a move above its 50DMA.
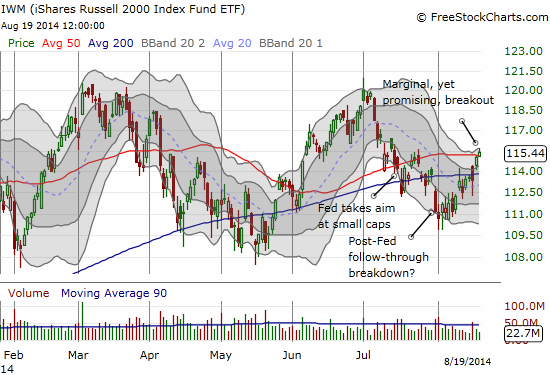
A tentative breakout for small-caps…just ahead of small-cap killer Janet Yellen’s appearance at Jackson Hole, Wyoming….
The bullish signals are piling one on top of each other now, caveats aside of course. It made me check in on my favorite bear/stubborn contrarian Doug Kass. As Kass likes to say when he is clowning the chatter-class when it says nothing to acknowledge it has called a trade seriously wrong: “crickets.” While there is nothing indicating what Kass has done, is doing, or plans to do with his accumulation of trades fighting against the S&P 500 and the NASDAQ in the wake of the bounce from oversold conditions (complete with on-going jawboning of course!), he has grasped for one potential contrarian/bearish indicator:
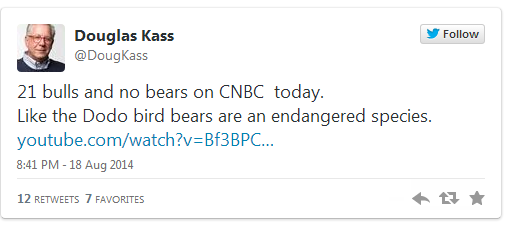
However, with the signals piling on as they are, I think these CNBC folks are right to be unabashedly bullish. There is little point in being outright bearish here until the market at least throws a bone like a fresh 50DMA breakdown or a true buying blow-off into, for example, overbought conditions.
Let’s also consider whether we can truly get any signal from counting the number of bulls versus bears in a CNBC production studio. First of all, I am not sure how much CNBC sentiment counts for anything anymore. After all, global ownership of equities is supposedly at a 50-year low, and it truly seems that only the die-hard market geeks care much about the stock market these days. Sometimes it even (anecdotally) seems like this bull market is hated quite thoroughly.
For the sake of this discussion, let’s say CNBC is indeed representative. We still need to know whether these are folks who are 1) always bullish or 2) bears converted to bulls. On #2, we need to know when the bears converted. A recent conversion from a die-hard bear to a bull is much more bearish than a bear who finally hopped aboard the uptrend in 2011, 2012, or even 2013. Late converters represent the classic last money chasing the last fumes of an over-extended run-up. Yet, it will be difficult to even make such a call when so little attention is focused on the market despite its historic run.
Doug Kass will be guest-hosting Bloomberg TV’s “Market Surveillance” on Thursday morning. I wish I had the opportunity to watch it. I am betting if the market happens to be weak the day before or that morning, Kass will use it as evidence of a top, confirmation of the contrarian view, a reminder that risk happens fast, etc… If not, the market’s rally will serve as a platform to berate market participants for blind complacency (smile – Kass, you know I love you…).
Finally, here are some more charts of interest.
Wix.com (WIX) has disappointed. The strong breakout on June 24th had absolutely no follow-through. WIX is even trading just below its 50DMA, is under-performing, and is still hovering just above its all-time low. I am stubbornly hanging on for the follow-through…or fresh lows.
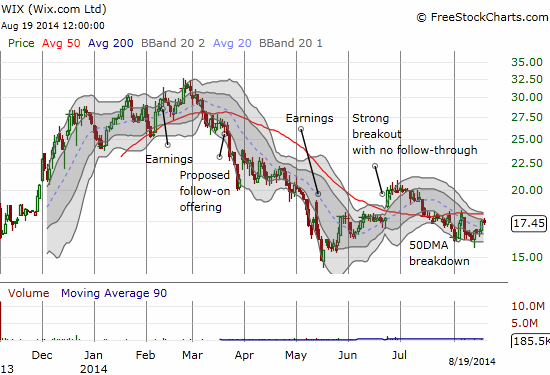
No follow-through for Wix.com as post-IPO lows still hold sway over trading
Last week, Kate Spade & Company (KATE) had one of the ugliest post-earnings fades you will ever see. The stock started off with a nice gap up and gained as much as 10% or so before absolutely collapsing. It cleaved through its 50DMA and then 200DMA like nobody’s business. It was so fast, I did not even have a chance to think about hopping aboard the downward express. Instead, seeing the stock over-extended below the lower-Bollinger Band (BB)…well, long-time readers should know what I did: I purchased some speculative call options. So far, so good…although I wish I had just purchased stock since the call options still came with an expensive implied volatility premium that has since fizzled a bit. I am also skeptical KATE can muster enough buying power to conquer looming, overhead resistance at its 200DMA.
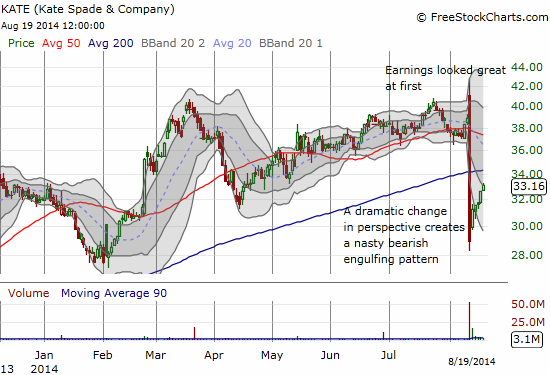
KATE is attempting a valiant recovery from a dramatic post-earnings collapse. Resistance should be tough…
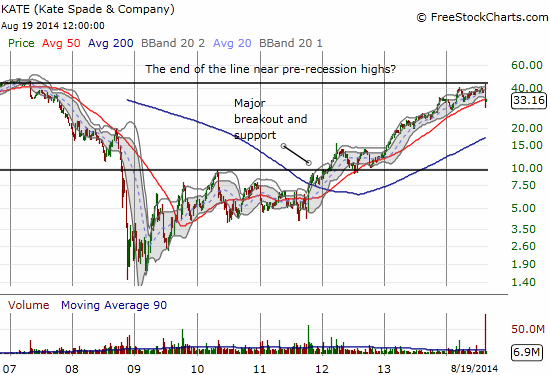
Overall, it seems earnings could have signaled the end of KATE’s run-up and longer-term recovery
GrubHub Inc. (GRUB) had a remarkable first day of trading when it went IPO on April 4, 2014 in the middle of a big swoon for high-multiple and momentum stocks. The stock priced at $26 after revising its range from $20-22 to $23-25. The stock promptly sold off and closed at $34. That seemed to be the end of the story and the beginning of the end for another over-hyped, over-valued internet/mobile play. The stock churned lower to $30 right as the sell-off in momentum and high-multiple stocks ended around May 20th. The stock has “quietly” fought its way back up. It made a failed retest of highs in early June, finally broke out on July 29th only to get faded. The sell-off ended early and formed a classically bullish cup and handle pattern that resolved into a very strong surge last week to fresh all-time highs. I treated the subsequent pullback as a rare “second chance” opportunity to hop aboard this bullish pattern.
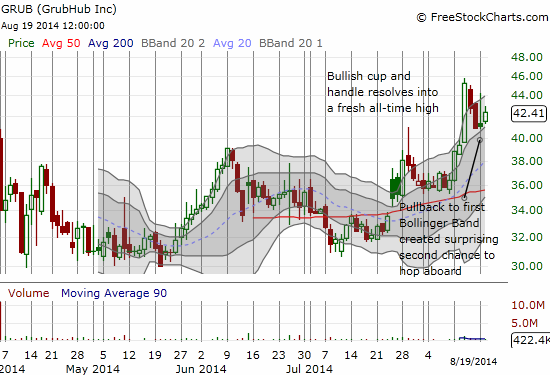
GrubHub is looking ready to surge much higher…
Finally, the one that got away: LinkedIn (LNKD). My rationale for locking in profits pre-earnings made perfect sense at the time. However, I feel a huge sense of irony that the post-earnings hurdle over the 200DMA did not renew my bullishness enough to hop back on. LNKD has gained another 10% or so since its post-earnings open, providing ample upside opportunity along the way. Until the last two days of weaker trading, LNKD has traded upward nearly non-stop (granted in baby steps along the way). A retest of converging 50 and 200DMA lines of support would be absolutely fascinating to behold (and hopefully trade).
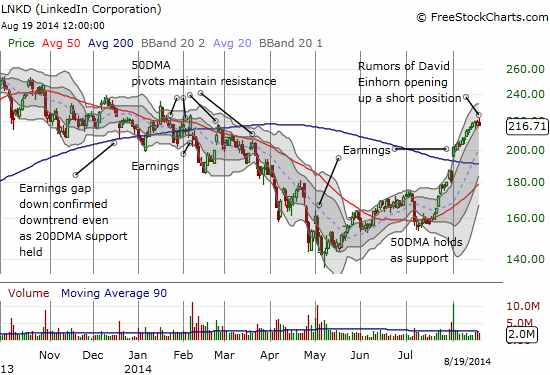
A dramatic turn in sentiment for LinkedIn
Daily T2108 vs the S&P 500

Black line: T2108 (measured on the right); Green line: S&P 500 (for comparative purposes)
Red line: T2108 Overbought (70%); Blue line: T2108 Oversold (20%)
Weekly T2108

Full disclosure: no positions


