
Summer 2016 Snapshot Of Expected Future S&P 500 Earnings
Every three months, just about at the time that the market's quarterly earnings season ends shortly after the midpoint of the quarter, we take a snapshot of the expectations for future earnings in the S&P 500.
Today, for the first time in the last seven quarters, the trailing twelve month average of the S&P 500's earnings per share has risen, which suggests that the earnings recession which took hold in the fourth quarter of 2015 may finally have bottomed.
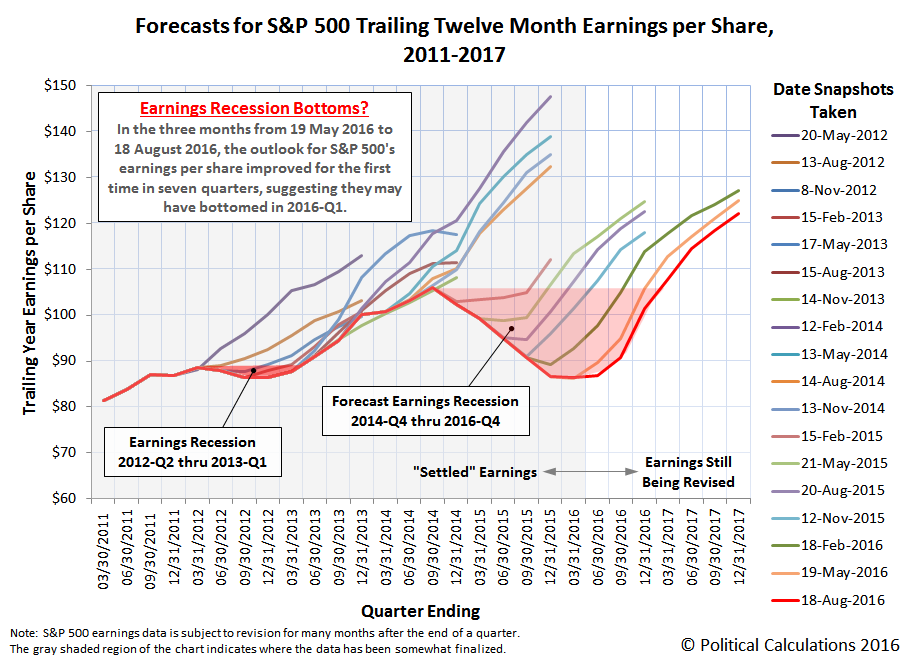
Going by S&P's current projections, the index' trailing year earnings per share may return to its pre-earnings recession levels in the first quarter of 2017.
The improvement in the S&P 500's earnings may be directly attributed to the rebound of crude oil prices since they bottomed in early February 2016, which have eliminated the downward pressure on earnings that have prevailed in the market's oil production sector since the end of June 2014.
Through Monday, 15 August 2016, the price of West Texas Intermediate crude oil at the Cushing, Oklahoma terminal stood at $45.72 per barrel, a nearly 75% improvement over the $26.19 per barrel it bottomed at back on 11 February 2016. Oil prices would have to rise by another 136% from that $45.72 per barrel figure to return to the $107.95 per barrel that was recorded on 20 June 2014.
We think that for S&P's latest projection of future earnings to hold, oil prices would have to continue their overall rise. However, since the current quarter of 2016-Q3 began, those prices have been somewhat choppy, so we think it is more likely that the recovery of the S&P 500's earnings per share to levels back above their pre-earnings recession levels will take longer than S&P projects.
This increase in the S&P 500's trailing year earnings per share is the first real positive news that the market has seen for its earnings prospects since mid-2014, and particularly the oil producing sector of the market. After having fallen for six consecutive quarters, it's about time that industry had some good news show up on its bottom line.
Data Source
Silverblatt, Howard. S&P Indices Market Attribute Series. S&P 500 Monthly Performance Data. S&P 500 Earnings and Estimate Report. [Excel Spreadsheet]. Updated 12 May 2016. Accessed 19 August 2016.
Disclosure: None.


Thanks for sharing