
Stocks Typically Decline 38% When This Takes Place
(Click on image to enlarge)
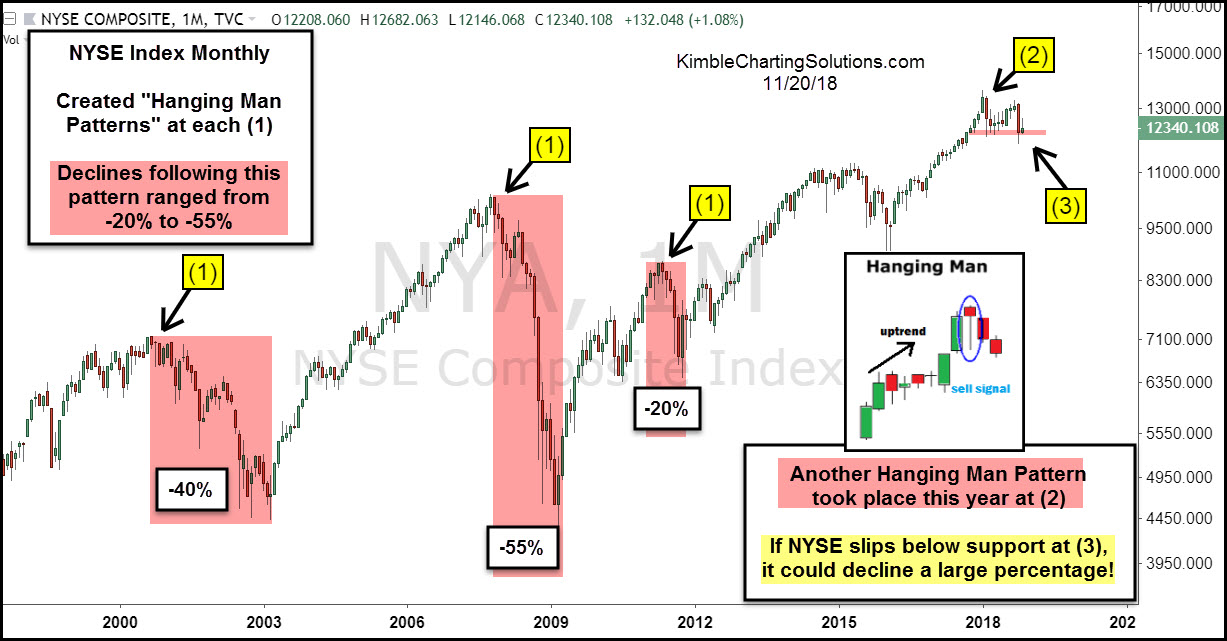
This chart looks at the NYSE index over the past 20-years, highlighting “Hanging Man Patterns,” where they have taken place and what typically happens following this pattern.
Monthly hanging man patterns took place near the highs in 2000, 2007 & 2011 at each (1). The average decline following this pattern was around 38% over the past 20-years.
The Power of the Pattern has been sharing this pattern for the past 9-months as a monthly hanging man pattern took place in February at (2).
With this pattern in play, the odds increase that the NYSE index will decline a good deal further if support breaks at (3).
Will the results be different this time??? The Power of the Pattern is of the opinion that the support test at (3) is very important for this broad-based index.
Sign up for Chris's Kimble Charting Solutions' email alerts--click here.


