
Stocks Set To Open Lower, Should You Buy?
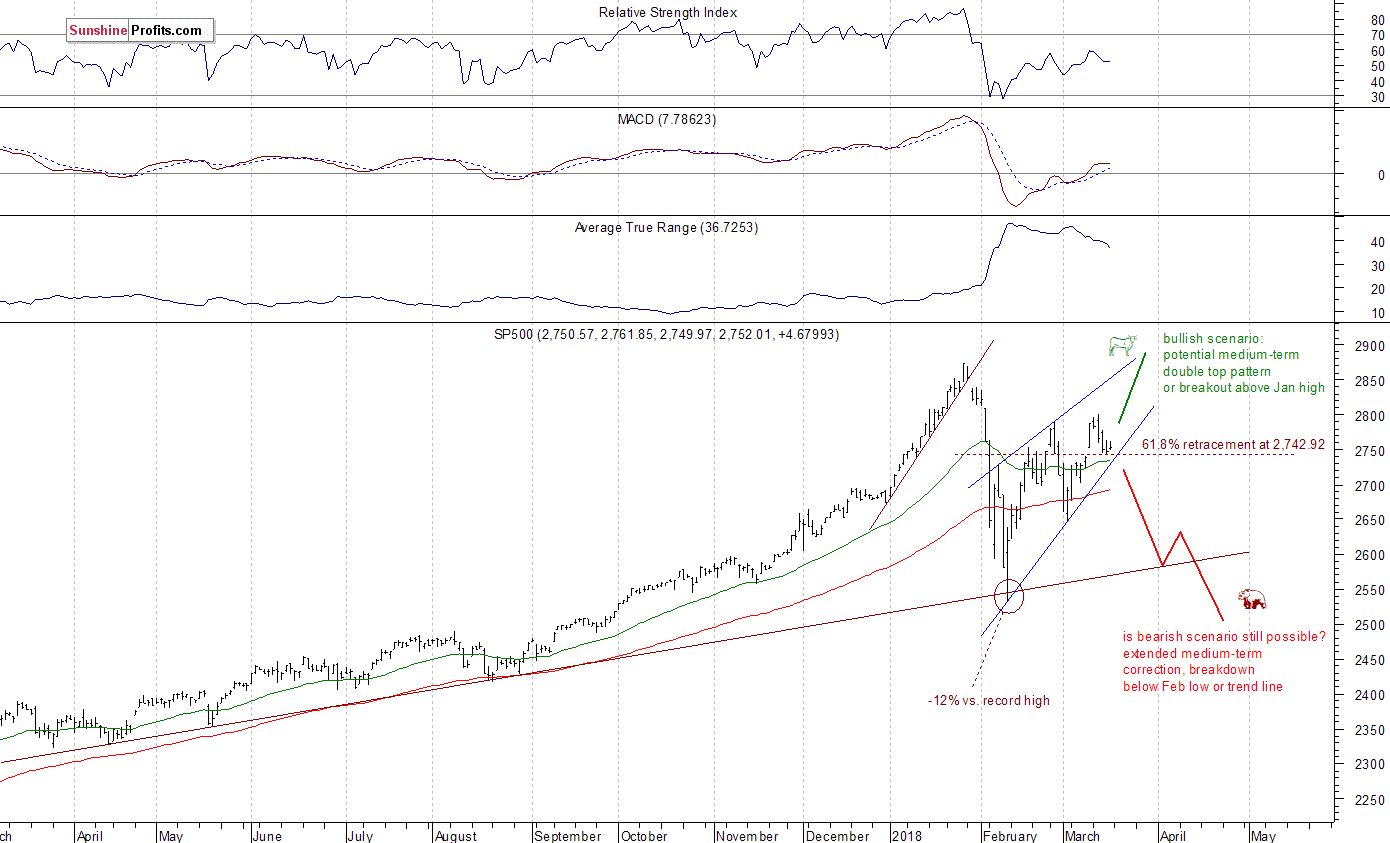
The U.S. stock market indexes were mixed between 0.0% and +0.3% on Friday, extending their short-term consolidation, as investors were undecided after recent move down. The S&P 500 index gained 0.2% and it remained at the support level of previous Friday's daily gap up. It currently trades 4.5% below January 26 record high of 2,872.87. The Dow Jones Industrial Average was relatively stronger than the broad stock market, as it gained 0.3%, and the technology Nasdaq Composite was unchanged.
The nearest important level of resistance of the S&P 500 index remains at around 2,775-2,780, marked by Wednesday's daily high. The next resistance level is at 2,790-2,800, marked by short-term local highs. On the other hand, support level is at 2,740-2,750, marked by previous Friday's daily gap up of 2,740.45-2,751.54. The next level of support is at 2,700-2,720, among others.
We can see that stocks reversed their medium-term upward course following whole retracement of January euphoria rally. Then the market bounced off its almost year-long medium-term upward trend line, and it retraced more than 61.8% of the sell-off within a few days of trading. Is this just an upward correction or uptrend leading to new all-time highs? The market is still in the middle of two possible future scenarios. The bearish case leads us to February low or lower after breaking below medium-term upward trend line, and the bullish one means potential double top pattern or breakout above the late January high. However, the worst future scenario for traders would be stocks going sideways:
(Click on image to enlarge)
Negative Expectations
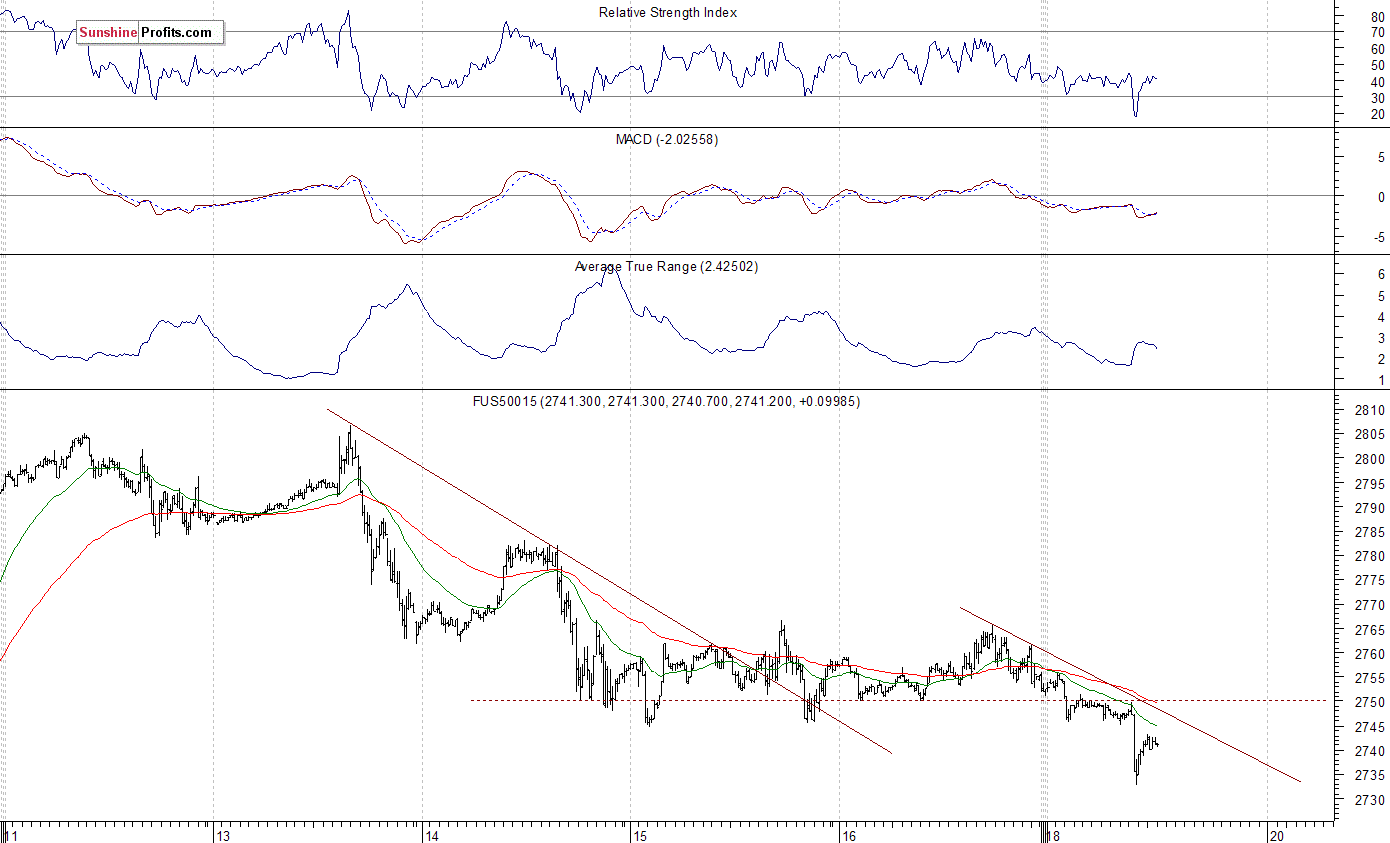
The index futures contracts are trading 0.5-1.3% lower vs. their Friday's closing prices, so expectations before the opening of today's trading session are very negative. The main European stock market indexes have lost 0.7-1.3% so far. There will be no new important economic data announcements today. The S&P 500 index remains at its previous Friday's daily gap up, which continues to act as a short-term support level. If the market breaks lower, it could continue towards the level of 2,700.
The S&P 500 futures contract trades within an intraday downtrend, following an overnight breakdown below Friday's trading range. The nearest important level of resistance is at around 2,745-2,750, marked by previous support level. On the other hand, support level is at 2,730-2,735, marked by short-term local low. The futures contract is below its recent short-term consolidation, as we can see on the 15-minute chart:
(Click on image to enlarge)
Nasdaq Much Weaker
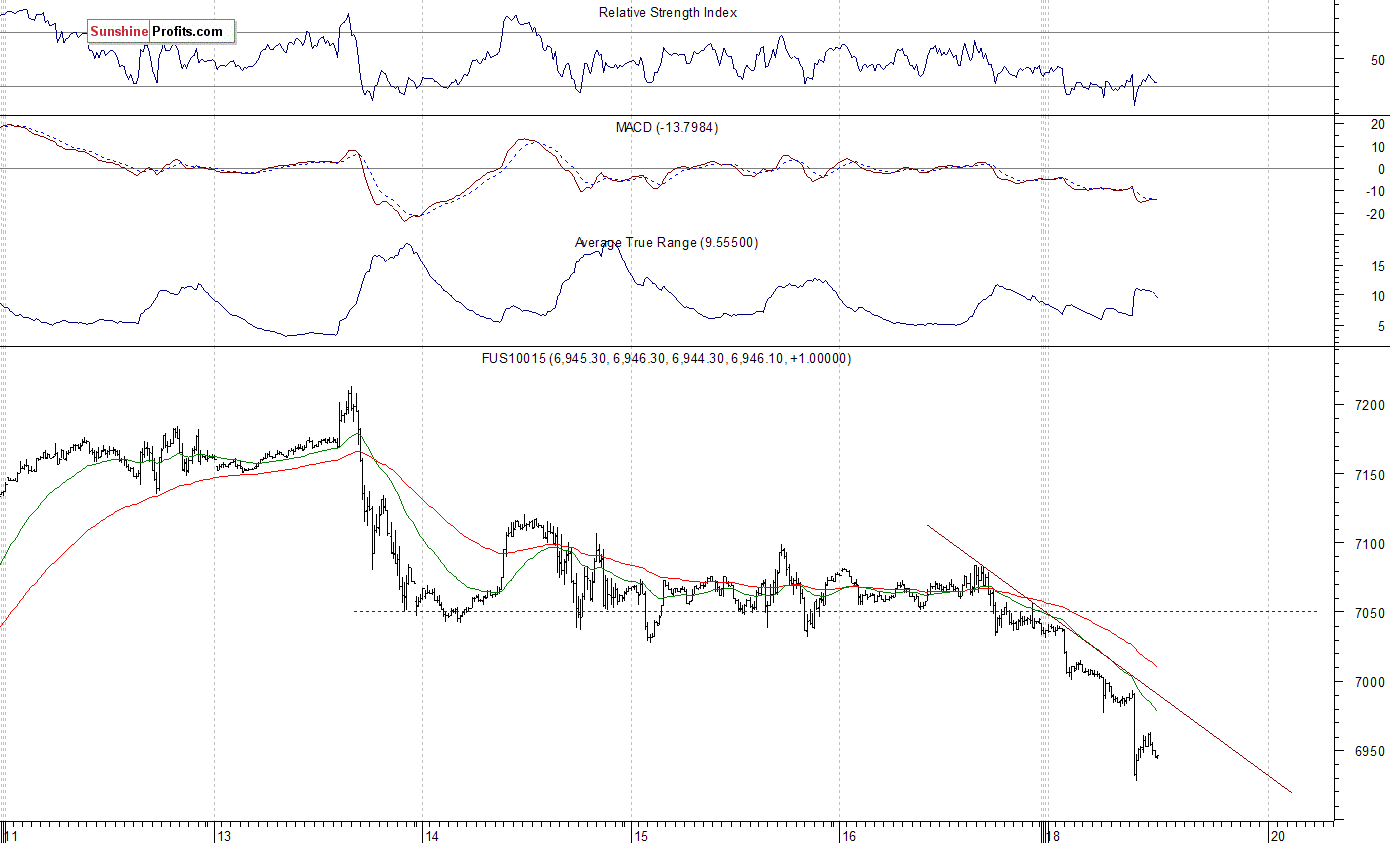
The technology Nasdaq 100 futures contract was weaker than the broad stock market on Friday, and it continues to be relatively weak this morning. It trades within an intraday downtrend after breaking below the level of 7,000. The market gained more than 1,000 points off its February 9 bottom, as it remarkably retraced all of its late January - early February sell-off in one month. So, it looks like a downward correction following this rally. However, a breakdown below 7,000 mark means that bulls are losing the battle here. The nearest important level of resistance is now at around 6,980-7,000, and support level is at 6,900, among others. The Nasdaq futures contract trades below its intraday downward trend line, as the 15-minute chart shows:
(Click on image to enlarge)
Two Biggest Market Caps Likely to Go Lower
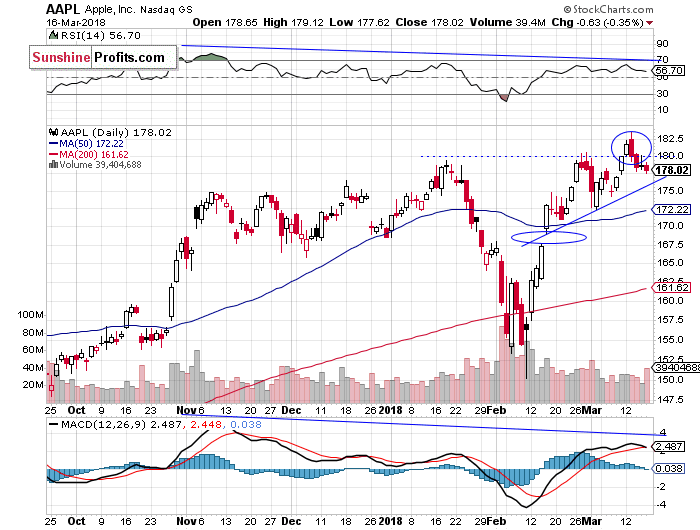
Let's take a look at Apple, Inc. stock (AAPL) daily chart (chart courtesy of http://stockcharts.com) again. The market reached new record high on Tuesday, but then it reversed its intraday uptrend and closed below $180. We saw some negative medium-term technical divergences - the most common divergences are between asset’s price and some indicator based on it (for instance the index and RSI or MACD based on the index). In this case, the divergence occurs when price forms a higher high and the indicator forms a lower high. It shows us that even though price reaches new highs, the fuel for the uptrend starts running low. On Tuesday, the market formed a negative candlestick chart pattern called "bearish engulfing". It consists of a smaller white candlestick followed by a black candlestick that "engulfs" the white one. This downward reversal pattern has been confirmed by Wednesday's move down. The price could reach its short-term upward trend line today, but will it bounce or break below that support level? It will probably break lower:
(Click on image to enlarge)
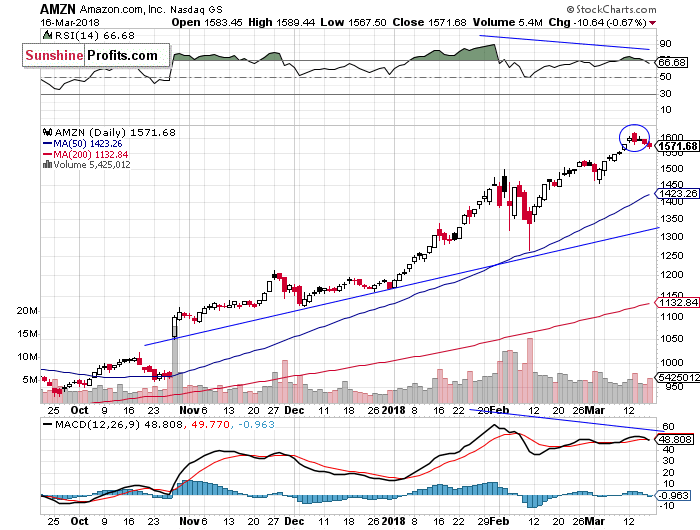
Amazon.com, Inc. stock (AMZN) continued its uptrend recently, as it reached new record high above the price of $1,600. The stock reversed its upward course on Tuesday and closed below previous day's closing price. Tuesday's trading action was bearish, as the stock formed a similar to the above-mentioned bearish engulfing pattern. The nearest important level of resistance remains at around $1,600, and we still can see negative technical divergences:
(Click on image to enlarge)
Dow Jones Remains Below 25,000 Mark
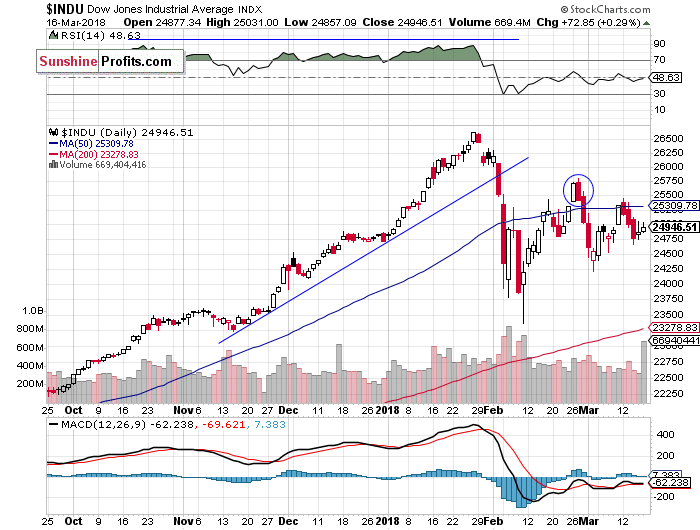
The Dow Jones Industrial Average daily chart shows that blue-chip index was relatively weaker than the broad stock market and much weaker than record-breaking technology stocks recently, as it continued to trade well below late February local high. The market broke below 25,000 mark on Wednesday, as it retraced more of its recent rebound. Possible support level is at around 24,250, marked by previous local low. If the index breaks lower, it could continue towards February 9 panic low. In late February, there was a negative candlestick pattern called Dark Cloud Cover, a pattern in which the uptrend continues with a long white body, and the next day it reverses following higher open and closes below the mid-point between open and close prices of the previous day. It acted as a resistance level, as we can see on the daily chart:
(Click on image to enlarge)
Concluding, the S&P 500 index is expected to open lower today, but it will probably continue to fluctuate along the support level of its previous daily gap up. We prefer to be out of the market again, avoiding low risk/reward ratio trades. So, we wouldn't buy yet. However, if the index continues lower, we would think about buying the dip at around the support level of 2,700.
Last week's rally failed to continue following negative political news releases. Was this just quick profit-taking action or more meaningful downward reversal? It's hard to say right now, but pre-session sentiment is negative today, as the index futures contracts trade much lower vs. their Friday's closing prices. It seems that the overall market risk is higher than in the late February when S&P 500 was trading at the same level.
Disclosure: None.


