
Stocks Resume Technical Breakout Despite Political Turmoil At Home And Abroad
In late May, the major US stock indexes finally eclipsed those pesky psychological levels and hit new highs, and this week they have managed to maintain the breakout even in the face of James Comey’s Congressional testimony and the British election, not to mention more saber-rattling from North Korea. The S&P 500 has held above 2,400, and the Dow has maintained the 21,000 level. The ultra-strong and Tech-heavy Nasdaq regained 6,300 and the Russell 2000 small caps moved back above 1,400 after both briefly pulling back below to test support early in the week. They both showed notable strength on Thursday after the James Comey testimony. Such backing-and-filling and technical consolidation was inevitable given that the proverbial “rubber band” was stretched so tight, with price rising well above the moving averages.
With the strength in Nasdaq, it should come as no surprise that the Technology sector has been by far the top performing sector, up about +22% year to date, while Energy has struggled, falling about -15% YTD. Notably, on Wednesday, oil prices fell more than 4% due to an unexpected rise in U.S. crude inventories.
In this periodic update, I give my view of the current market environment, offer a technical analysis of the S&P 500 chart, review Sabrient’s weekly fundamentals-based SectorCast rankings of the ten U.S. business sectors, and then offer up some actionable ETF trading ideas. In summary, our sector rankings still look bullish, while the sector rotation model maintains its bullish bias. Volatility remains historically low, economic conditions continue to improve, and overall, the climate seems quite favorable for risk assets like equities – particularly dividend payers, small caps, and GARP stocks (i.e., growth companies among all caps selling at attractive forward PEG ratios). Read on....
Market overview:
Given our government’s singular reliance for the past several years on monetary policy without any complementary fiscal stimulus, I see it as likely that our economy is still in the early expansion phase of the business cycle, just plodding along on the back of asset inflation while awaiting the next stage of earnings-driven growth, which finally seems to be underway. Thus, the peak phase of the business cycle (which would generally foreshadow a recession) may still to be years away. Moreover, although Sabrient does not have its own macroeconomic model, I like to read the tea leaves of our quant models to infer the implicit assumptions of the analyst community and the trends suggested by the aggregate projections of their earnings models, which leads me to this market outlook:
1.Low yield environment persists; modest inflation; rising GDP; continued share buybacks; resurgence in corporate capex
2.Oil prices remain in Goldilocks range ($40-60); cheap commodity prices persist
3.US fiscal stimulus begins to some extent (particularly tax and regulatory reform), which complements still-accommodative Fed monetary policy
If these expectations indeed play out, I would expect to see a continued improvement in market breadth, low sector correlations, and widening performance dispersion among individual stocks, which would mean that investors are discerning as to which companies they want to own, thus creating both winners and losers, as opposed to all boats rising or falling together with the tide. Overall, I expect investor focus on the solid global fundamentals and improving corporate earnings, rather than simply reacting to the daily news.
Unemployment fell to 4.3%, which is the lowest level in 16 years, while labor force participation declined to 62.7%, primarily due to increasing numbers of workers hitting retirement age. There are now over 6 million job openings according to the BLM’s JOLTS report. As of April, the number of unemployed workers per job opening in the U.S. hit a record low of 1.2 (compared to more than 6.0 after the Financial Crisis). As a result, the Q2 GDPNow estimate is 3.4% as of June, with a new update due out mid-day on Friday.
For several years, the Fed’s essentially free money encouraged companies to take the quick-and-easy path of borrowing to fuel share buybacks. This has supported EPS in the short term but has done little to enhance long-term prospects, as would be gleaned from capital expenditures. I have written often about the undesirable impacts of our sole reliance on Fed monetary policies like ZIRP and QE to stimulate the economy, including a recession in both capex and profits and the widening wealth gap, so it seems that a combination of fiscal stimulus and executive compensation tied to longer-term goals (rather than short-term stock price performance) would better support long-term growth in corporate revenues and earnings as well as sustainable stock price appreciation.
As for equity valuations, there are many dynamics supporting the elevated valuation multiples. For one, our services oriented economy is not so vulnerable to a low-cost competitor like it often is in a manufacturing economy, so higher margins are attainable. Furthermore, a P/E of 20 suggests an earnings yield (or real return) of 5%, or 7% nominal return (including inflation), which is well above the benchmark 10-year Treasury yield (under 2.2%). Also, when you combine the S&P 500 dividend yield of 1.9% with share buybacks, the total “returned capital yield” exceeds 4.0%, which is relatively attractive compared to the 10-year Treasury. Moreover, comparisons with historical P/E or the oft-cited cyclically-adjusted price-earnings ratio (CAPE) can be misleading when you consider that GAAP accounting standards have stiffened through the years, thus artificially shrinking the denominator of the equation.
Another consideration is that the stock market reacts to supply and demand just like any other market. So, as corporate America continues to buy back shares (a practice that typically accelerates in June after Q1 earnings season), outstanding float continues to shrink while money supply expands into the hands of return-hungry investors who perceive few attractive alternatives other than risk assets.
Of course, there are plenty of risks out there, including our federal government dysfunction and the toxic political environment that is essentially preventing any meaningful progress on fiscal stimulus, not to mention a litany of geopolitical threats. On Thursday, you couldn’t escape the Comey testimony as all TV stations were broadcasting it. But at the end of it all, it appears that despite all the consternation and gnashing of teeth leading into the day, there is no smoking gun, and in response, large cap indexes essentially finished flat while the Russell 2000 small caps (the expected beneficiaries of the Trump Trade) rose +1.37%.
I sincerely believe that none of the many geopolitical dramas are likely to impact the steady pace of improvement in the global economy and the stock market. Instead, my greatest fear is China, due to their opaque economic reporting and inordinate government spending that has led to a credit bubble – all to keep the China Miracle going while simultaneously seeking to liberalize its capital account in order to gain prominence as one of the big players in the global monetary system. However, after previously pledging to move quickly to drop capital controls and make the yuan fully convertible, China instead will need to maintain a “closed” capital account, meaning companies, banks and individuals can’t move money in or out of the country except in accordance with strict rules. Loosening those controls was intended to attract foreign investment, even though capital controls have saved China from the erratic flow of capital that has buffeted other emerging market countries.
In the old days, the Fed could essentially regulate the global economy through its policies, given the huge impact of the US. But now that China has become the primary engine of global growth, the Fed no longer has much control – certainly not of China’s practice of fueling economic growth through credit.
China must now attempt the circus balancing act of bleeding down its massive debt, cooling off the housing market, slowing the growth of new credit, and tightening government spending while at the same time supporting its currency and maintaining stable growth. But Moody's recently expressed its doubts by downgrading China's long-term currency issuer ratings to A1, citing an anticipated gradual erosion of China's credit profile. Notably, the Caixin Manufacturing PMI signaled contraction with a reading of 49.6 (versus estimate of 50.1).
Because President Trump recently indicated to President Xi that other issues – like the North Korea problem and opening up Chinese markets to American goods – are more important to him than currency manipulation, China can now pull out all stops to avoid a hard landing. The Chinese government won’t want to risk allowing the yuan to float freely against other currencies, which could prove highly disruptive. So instead it may ultimately conduct a controlled devaluation – perhaps a significant one. As we saw in summer 2015, this would be bad for oil and commodity prices, emerging markets, high-yield bonds, and the Industrial sector, and may lead to global deflation, falling bond yields, and a surging US dollar (although not necessarily an outright recession in the US).
No doubt, currency exchange rates can have a big impact on returns. For example, if you look at the S&P 500 performance this year priced in dollars, it is up +8.7%, while the Euro STOXX 50 priced in euros is up +8.9%. So, they are similar, right? Well, if you consider that the euro has appreciated about 7.5% versus the dollar, the S&P 500 is nearly flat YTD when priced in euros. So, for the European investor who bought dollars to invest in the S&P 500 and now wants to exchange his US gains back into euros, he makes only +2.0%, while the American who invested in Europe is able to take a +16.5% gain when he exchanges back into dollars.
Treasuries have weakened considerably over the past month. The 10-year Treasury closed Thursday at 2.19% while the 30-year closed at 2.86%. On the short end of the yield curve, the 2-year closed at 1.31% and the 5-year at 1.75%. A popular way to measure the slope of the yield curve slope is the 2-10 spread, and the spread between the 10-year and 2-year has flattened to 88 bps, which is a good bit less than the 101 bps on Election Day. As the yield curve flattens, banking stocks have struggled. On the other hand, the spread between the 30-year and 5-year remains at 111 bps, where it was when I wrote my previous article on May 12. CME fed funds futures now place the odds of a June rate hike at 99.6%, and 24% of yet another one in September, rising to 52% by December.
Some commentators are surprised that both stocks and bonds have caught a bid at the same time, but I am not. I have seen the potential this year for both to appreciate, especially given the QE programs still going on overseas and the associated carry trade pushing cheap foreign capital into relatively higher-yielding (and risk-free) US Treasuries. At the same time, those seeking higher returns are taking comfort in the improving global fundamentals and turning to risk assets like stocks (including defensive dividend payers like Utilities and Staples, which are both up about +11% YTD).
I’m still bullish on small caps, even though many big-money traders appear to be betting against them (and the so-called Trump trade that jumpstarted small caps after the election) by taking on the biggest net short position in six years on the Russell 2000, according to the Commodity Futures Trading Commission. Nevertheless, the forward valuations look attractive relative to large caps. Thus, while the S&P 500 large cap index reflects a forward PEG of 1.54, the Russell 2000 small cap index has a slightly lower forward PEG of 1.40. I expect normal internal rotation within the bull market will allow small caps to finally start outperforming again, in their next leg up after the initial post-election surge. Look for confirmation from the Russell 2000 breaking to new highs above 1,420.
Indeed, market action after the Comey testimony certainly favored small caps. Moreover, an improving regulatory environment particularly benefits small caps. For example, while many multinational giants have vociferously opposed the president’s decision to exit the Paris climate accord, many small companies have embraced the decision. Why? In a nutshell, expensive regulatory requirements help large companies keep at bay those upstart competitors who might otherwise challenge them but are less able to absorb the costs imposed by the regulation.
The CBOE Market Volatility Index (VIX), aka fear gauge, closed Thursday at 10.16. The slow but steady melt up in stocks has led to the lowest sustained volatility in 24 years. This complacency can persist for a long time, although as an oscillator, VIX will eventually spike again. It’s only a matter of when.
SPY chart review:
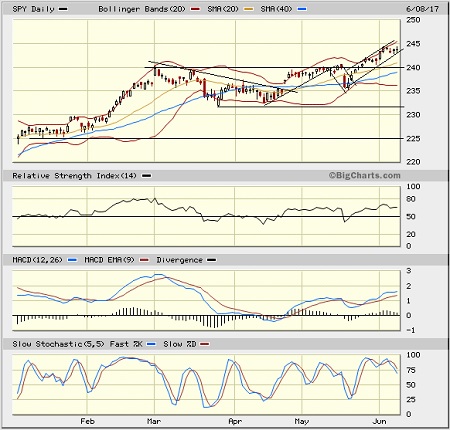
The SPDR S&P 500 ETF (SPY) closed Thursday at 243.78 after finally breaking through tough psychological resistance at 240 (corresponding to 2,400 on the S&P 500 index). It’s falling from resistance in mid-May resulted in a bull flag pattern with an upside breakout, and now it’s in a bullish rising channel. Oscillators RSI, MACD, and Slow Stochastic may not have sufficiently cycled to oversold territory to create a great launch pad, and the price gap above the 20-day and 50-day simple moving averages is still stretched, while Bollinger Bands have yawned wide, so I expect to see a bit more in the way technical consolidation to work off these conditions before it goes meaningfully higher. Support levels include the 20-day SMA near 241, resistance-turned-support at 240, the 50-day around 238, the 100-day SMA near 236, a minor low at 235, a prior low at 232, and the critical 200-day SMA (approaching 228). Overall, the technical picture continues to look pretty good for the medium term, with blue skies overhead. However, I am concerned about narrowing market breadth during this latest steady surge, as well as the amount of time since the last meaningful correction.
Latest sector rankings:
Relative sector rankings are based on our proprietary SectorCast model, which builds a composite profile of each of over 600 equity ETFs based on bottom-up aggregate scoring of the constituent stocks. The Outlook Score employs a forward-looking, fundamentals-based multifactor algorithm considering forward valuation, historical and projected earnings growth, the dynamics of Wall Street analysts’ consensus earnings estimates and recent revisions (up or down), quality and sustainability of reported earnings (forensic accounting), and various return ratios. It helps us predict relative performance over the next 1-3 months.
In addition, SectorCast computes a Bull Score and Bear Score for each ETF based on recent price behavior of the constituent stocks on particularly strong and weak market days. High Bull score indicates that stocks within the ETF recently have tended toward relative outperformance when the market is strong, while a high Bear score indicates that stocks within the ETF have tended to hold up relatively well (i.e., safe havens) when the market is weak.
Outlook score is forward-looking while Bull and Bear are backward-looking. As a group, these three scores can be helpful for positioning a portfolio for a given set of anticipated market conditions. Of course, each ETF holds a unique portfolio of stocks and position weights, so the sectors represented will score differently depending upon which set of ETFs is used. We use the iShares that represent the ten major U.S. business sectors: Financial (IYF), Technology (IYW), Industrial (IYJ), Healthcare (IYH), Consumer Goods (IYK), Consumer Services (IYC), Energy (IYE), Basic Materials (IYM), Telecommunications (IYZ), and Utilities (IDU). Whereas the Select Sector SPDRs only contain stocks from the S&P 500, I prefer the iShares for their larger universe and broader diversity.
Looking back six months to my Sector Detector article on December 7, the top two sectors at that time were Tech and Financial while the bottom two were Energy and Telecom, and that is exactly how the past six months performance has panned out, with Tech +26%, Financial +21%, Energy -5.0%, and Telecom -5.5%.
Here are some of my observations on this week’s scores:
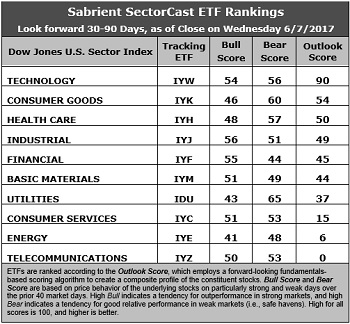
1.Technology stands alone at the top of the pack with an Outlook score of 90. In fact, I hate to even name a second-place sector because the gap down is 36 points to Consumer Goods (Staples/Noncyclical), which is essentially bunched together with four other sectors (Healthcare, Industrial, Financial, and Basic Materials) in a 10-point range between 54-44. In aggregate, stocks within Technology display among the best Wall Street sell-side analyst sentiment (i.e., net positive revisions to EPS estimates), the best insider sentiment (net open market buying), the highest return ratios, a mediocre forward P/E of about 18.3x, a strong forward long-term EPS year-over-year growth rate of 14.0%, and a low forward PEG of 1.30 (ratio of forward P/E to forward EPS growth rate). Consumer Goods rose to Number 2 due to its solid Wall Street sentiment and excellent return ratios, although the forward P/E and PEG aren’t highly attractive. Notably, Healthcare and Financial share the lowest forward P/E of 16.3x.
2.Energy and Telecom remain in the bottom two with Outlook scores of 6 and 0, respectively. Telecom displays weak scores across the board, including the weakest analyst sentiment (i.e., net negative earnings revisions), as well as the highest forward P/E of 28.3x and the second highest (next to Utilities) forward PEG of 3.35. Energy has generally poor factor scores across the board, including the worst return ratios and a high forward P/E of 26.8x, although it notably boasts the highest year-over-year forward EPS growth rate (28%) on weak comps and a low forward PEG of only 0.96.
3.Looking at the Bull scores, Industrial boasts the top score of 56, followed closely by Financial, as it has displayed relative strength on strong market days, while Energy is the lowest at 41. The top-bottom spread is 15 points, which reflects moderately low sector correlations on strong market days, which is favorable for stock picking. It is desirable in a healthy market to see low correlations reflected in a top-bottom spread of at least 20 points, which indicates that investors have clear preferences in the market segments and stocks they want to hold (rather than broad risk-on behavior).
4.Looking at the Bear scores, we find Utilities at the top with a score of 65, followed by Consumer Goods (Staples/Noncyclical), which means that stocks within these sectors have been the preferred safe havens lately on weak market days. Financial is the lowest at 44, as investors have fled during market weakness. The top-bottom spread is 21 points, which reflects low sector correlations on weak market days. Ideally, certain sectors will hold up relatively well while others are selling off (rather than broad risk-off behavior), so it is desirable in a healthy market to see low correlations reflected in a top-bottom spread of at least 20 points.
5. Technology displays the best all-around combination of Outlook/Bull/Bear scores, while Energy is the worst. Looking at just the Bull/Bear combination, Technology is the best, indicating superior relative performance (on average) in extreme market conditions (whether bullish or bearish), while Energy by far scores the worst, as investors have generally avoided the sector.
6.This week’s fundamentals-based Outlook rankings still look mostly bullish to me, given that the five of the top six sectors are economically-sensitive or all-weather (Technology, Healthcare, Industrial, Financial, and Materials). On the other hand, only three sectors score 50 or higher (with one being a defensive sector), which is somewhat troubling. Keep in mind, the Outlook Rank does not include timing, momentum, or relative strength factors, but rather reflects the consensus fundamental expectations at a given point in time for individual stocks, aggregated by sector.
ETF Trading Ideas:
Our Sector Rotation model, which appropriately weights Outlook, Bull, and Bear scores in accordance with the overall market’s prevailing trend (bullish, neutral, or defensive), displays a bullish bias and suggests holding Technology (IYW), Industrial (IYJ), and Financial (IYF), in that order. (Note: In this model, we consider the bias to be bullish from a rules-based trend-following standpoint when SPY is above both its 50-day and 200-day simple moving averages.)
Besides iShares’ IYW, IYJ, and IYF, other highly-ranked ETFs in our SectorCast model (which scores over 600 US-listed equity ETFs) from the Technology, Financial, Industrial sectors include First Trust Nasdaq-100 Tech Sector Index Fund (QTEC), US Global Jets ETF (JETS), and First Trust Nasdaq ABA Community Bank Index Fund (QABA).
If you prefer a neutral bias, the Sector Rotation model suggests holding Technology, Consumer Goods (Staples/Noncyclical), and Healthcare, in that order. On the other hand, if you are more comfortable with a defensive stance on the market, the model suggests holding Utilities, Technology, and Consumer Goods (Staples/Noncyclical), in that order.
By the way, an assortment of other unique ETFs that happen to score well in our latest rankings include VanEck Vectors Mortgage REIT Income (MORT), Arrow QVM Equity Factor ETF (QVM), PowerShares International Dividend Achievers Portfolio (PID), iShares MSCI Israel Capped ETF (EIS), John Hancock Multifactor Technology ETF (JHMT), SPDR MFS Systematic Value Equity ETF (SYV), iShares US Home Construction ETF (ITB), PowerShares Contrarian Opportunities Portfolio (CNTR), and Direxion All Cap Insider Sentiment Shares (KNOW), which tracks a Sabrient index.
Disclosure: The author has no positions in stocks or ETFs mentioned.
Disclaimer: This newsletter is published solely for informational purposes and is ...
more

