
Stocks Get Vote Of Confidence, But Tough Tests Lie Ahead
Stocks got a vote of confidence last week, plus some short-covering support (and perhaps some panic buying (for fear of missing out), and now the S&P 500 (SPY) as of Friday is down only -2.2% YTD, and up +8% since its close on February 12. The Russell 2000 (IWM) small caps are up +12% over the same timeframe. At the same time, when priced in constant US dollar, we see that Chinese stocks are down -19% YTD, Italy -14%, Germany -8%, Japan -5% (and -10% in yen), while Brazil is up +20%, Colombia +13%, Russia +9%, and Canada +5%. Notably, those that are down (other than the U.S.) are all implementing massive monetary stimulus (including negative interest rates, in some cases), while those that are up do not have that option.
Emerging markets and commodity prices have been looking strong since mid-January. Now we are hearing rumblings of a “Brexit” from the EU, as Britain will hold a referendum on the subject on June 23, and of course the Presidential election cycle is in full bloom, with riotous debates and outlandish policy proposals making for quite the spectacle. Although headlines continue to “Trump” fundamentals (pun intended) for the time being, I still believe that economic and corporate fundamentals will soon gain traction once again among investors when it comes to stock pricing. Perhaps it is starting now.
In this weekly update, I give my view of the current market environment, offer a technical analysis of the S&P 500 chart, review our weekly fundamentals-based SectorCast rankings of the ten U.S. business sectors, and then offer up some actionable trading ideas, including a sector rotation strategy using ETFs.
Market overview:
At the G-20 Summit, world leaders again called for more fiscal measures and structural reforms -- as opposed to simply relying on central banks’ monetary policies to fill the void, as this alone cannot create sustained economic growth. Case in point, Europe’s inflation has fallen to -0.2% despite monetary stimulus. Measures would need to involve thoughtful government spending programs (e.g., “helicopter money”), reducing barriers to business creation and expansion (like excessive regulation or protectionist policies), tackling corruption, and putting an end to the “race to debase” through currency devaluations.
It is ironic that while countries like Iran and China continue to display a desire to embrace principles of free market capitalism and the rule of law as a path toward prosperity, here in the U.S. many citizens (especially young people) are conflicted on the benefits of capitalism, largely due to growing income inequality. Many believe a reliance on the Federal Reserve’s monetary policy (from non-elected officials) rather than fiscal/budgetary policy from our elected officials has resulted in a slow-growth economy and financial asset inflation that has provided greater benefits to the wealthy than to the masses. This has led a growing segment of our citizenry to embrace populist messages from both ends of the political spectrum.
Many Americans feel they can no longer tolerate the status quo. For some with a conservative leaning, they are fed up with a dysfunctional Congress and a President who prefers to avoid the fray and simply govern by executive order. They want to send the schoolyard bully into town to kick butt, take names, build a wall, tear up trade agreements, dismantle towering federal bureaucracies, and insulate America from a turbulent world. For some with a liberal leaning, they are tired of gridlock in Washington and want to insulate America from a turbulent world, but believe the solution is in paternalism and a broader safety net.
It’s ironic that in this great country built by immigrants seeking freedom, liberty, and opportunity, so many citizens (especially young people) now take those ideals for granted and are essentially willing to compromise them, often because they see no viable path to prosperity while grappling with student loan debt, car payments, high rent, and meager salaries. However, my view is that our ability to pursue the American dream has been hindered by overreaching government intervention and regulation, and so the answer is not in more regulation, protectionism, isolationism, paternalism, or entitlements, but less.
Getting back on topic, it appears that fears of a recession here at home are moderating as economic activity has stabilized. Retail sales, existing home sales, PMI, beige book, consumer confidence, unemployment and jobs have all been solid or stable in the latest reports, while wage inflation has slowed a bit -- thus giving the Fed a solid reason to postpone a March rate hike but still allowing it to talk up our economic progress.
Indeed, fed funds futures are now dismissing any probability of a March rate hike, but for April the probability of at least one quarter-point hike is 5%, June 30%, September 49%, and by December there is a 65% probability of at least one hike and a 23% chance that we will see two rate hikes. The flight to safety among global investors continues to depress Treasury yields. The 10-year Treasury yield closed Monday at 1.90%, while the 2-year yield closed at 0.91%. Compared to two weeks ago, both have risen about 15 bps but the spread between them has stayed flat at 0.99.
Nevertheless, we are still faced with a reduced growth in corporate revenue and earnings, at least for the near term, as S&P Global Market Intelligence reports that 2016 S&P 500 EPS consensus estimates have dropped to $119.50 (implying a forward PE ratio of 16.7x) versus the earlier expectation of $129.30 (forward PE of 15.5x) three months ago. Notably, the main drag is the front half of the year, and Wall Street’s consensus is that the second half of 2016 looks much stronger than the first half.
Although the decline in expected corporate earnings is across most of the business sectors rather than concentrated in Energy and Materials, the Consumer Services (Discretionary/Cyclical) sector is a bright spot that continues to show solid growth expectations, which is a testament to the U.S. consumer. Indeed, Sabrient’s quant models -- based on a bottom-up view of the world, aggregating the many micro views of market segments from the sell-side analyst community to create an overall macro picture -- have been pointing to the U.S., and the American consumer in particular, as the epicenter of economic strength.
The CBOE Market Volatility Index (VIX), a.k.a. fear gauge, closed Monday at 17.35, which is in the zone of complacency in this new normal of elevated volatility. S&P Dow Jones Indices reports that for February, correlations in the U.S. have returned to below-average levels, which is healthy, while outside the U.S., and for Europe in particular, correlations remain elevated, which suggests continued market fragility.
SPY chart review:
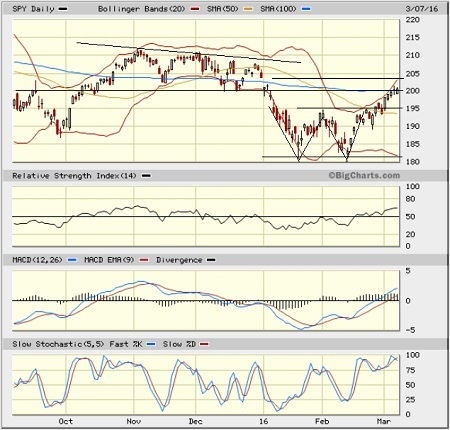
The SPDR S&P 500 Trust closed Friday just above the 200 mark, and then faced a little consolidation on Monday at this resistance level, closing the day at 199. After bouncing strongly from the long-standing support line of “last resort” near 182, and then forming a bullish W-pattern, it confirmed the W by rising above the 195 level, and now is in the process of challenging resistance levels, starting with the 200 price level (which we knew would be a tough test), which also happens to be the 100-day simple moving average. If successful, next resistance is the bearish gap down from 204 at the beginning of the year that should act as a magnet. Beyond that, there is a line of lower highs since last May as well as a broad rounding top to contend with, once it gets above 204. SPY is now above its short-term 20-day simple moving average and its 50-day simple moving average, but still below the 200-day SMA (near 202). Oscillators RSI, MACD, and Slow Stochastic are all looking a tad overbought and need to either consolidate for a bit or pull back. Support should come in at the 195 level (resistance-turned-support).
Latest sector rankings:
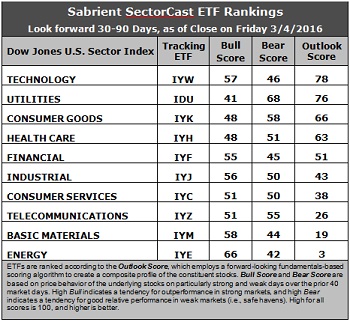
Relative sector rankings are based on our proprietary SectorCast model, which builds a composite profile of each equity ETF based on bottom-up aggregate scoring of the constituent stocks. The Outlook Score employs a forward-looking, fundamentals-based multi factor algorithm considering forward valuation, historical and projected earnings growth, the dynamics of Wall Street analysts’ consensus earnings estimates and recent revisions (up or down), quality and sustainability of reported earnings (forensic accounting), and various return ratios. It helps us predict relative performance over the next 1-3 months.
In addition, SectorCast computes a Bull Score and Bear Score for each ETF based on recent price behavior of the constituent stocks on particularly strong and weak market days. High Bull score indicates that stocks within the ETF recently have tended toward relative outperformance when the market is strong, while a high Bear score indicates that stocks within the ETF have tended to hold up relatively well (i.e., safe havens) when the market is weak.
Outlook score is forward-looking while Bull and Bear are backward-looking. As a group, these three scores can be helpful for positioning a portfolio for a given set of anticipated market conditions. Of course, each ETF holds a unique portfolio of stocks and position weights, so the sectors represented will score differently depending upon which set of ETFs is used. We use the iShares that represent the ten major U.S. business sectors: Financial (IYF), Technology (IYW), Industrial (IYJ), Healthcare (IYH), Consumer Goods (IYK), Consumer Services (IYC), Energy (IYE), Basic Materials (IYM), Telecommunications (IYZ), and Utilities (IDU). Whereas the Select Sector SPDRs only contain stocks from the S&P 500, I prefer the iShares for their larger universe and broader diversity. Fidelity also offers a group of sector ETFs with an even larger number of constituents in each.
Here are some of my observations on this week’s scores:
1.Technology regains the top spot with an Outlook score of 78. It displays positive Wall Street analyst sentiment (net upward revisions to earnings estimates), the highest forward long-term growth rate, and strong return ratios. Utilities takes the second spot with an Outlook score of 76 and displays the best sell-side analyst sentiment. Consumer Goods (Staples/Noncyclical) has good sell-side sentiment and return ratios. Healthcare and Financial round out the top five. Notably, Financial still displays the lowest aggregate forward P/E (14x), although it continues to rise as the sector gets hit with net reductions to earnings estimates given the ongoing rethinking of the future of interest rates and the shape of the yield curve.
2.Energy remains at the bottom with an Outlook score of 3 as the sector scores among the worst in all factors of the GARP model, including the highest forward P/E (29.7x), which has risen dramatically as the sector has rallied. Also, it is the only sector to display a negative long-term growth rate. Basic Materials takes the other spot in the bottom two with an Outlook score of 19 and continues to bear the brunt of the downward revisions to earnings estimates.
3.Looking at the Bull scores, Energy tops the list with a robust 66, as short-covering and bottom-fishing kick in on strong market days, while Utilities is the lowest at 41. The top-bottom spread is a wide 25 points, which continues to reflect quite low sector correlations on strong market days, which is good for stock picking. It is generally desirable in a healthy market to see low correlations reflected in a top-bottom spread of at least 20 points, which indicates that investors have clear preferences in the stocks they want to hold (rather than broad risk-on behavior).
4.Looking at the Bear scores, Utilities (as usual) displays the top score of 68, followed by Consumer Goods (Staples/Noncyclical), which means that stocks within this sector have been the preferred safe havens on weak market days. Energy scores the lowest at 42, as investors flee during market weakness. The top-bottom spread is a wide 26 points, which reflects quite low sector correlations on weak market days, which is good for stock picking. Ideally, certain sectors will hold up relatively well while others are selling off (rather than broad risk-off behavior), so it is generally desirable in a healthy market to see low correlations reflected in a top-bottom spread of at least 20 points.
5.Utilities displays the best all-around combination of Outlook/Bull/Bear scores, while Energy is the worst. However, looking at just the Bull/Bear combination, Utilities is the best, followed by Energy, indicating superior relative performance (on average) in extreme market conditions (whether bullish or bearish), while Healthcare is the worst, followed closely by Financial.
6.This week’s fundamentals-based Outlook rankings still look neutral, with continuing signs of defensiveness given that Utilities and Consumer Goods (Staples/Noncyclical) are in the top three. On the other hand, Technology, Financial, and all-weather Healthcare continue to show up in the top five, and Industrial is starting to make a case for itself, as well. Keep in mind, the Outlook Rank does not include timing, momentum, or relative strength factors, but rather is a reflection of the fundamental expectations of individual stocks aggregated by sector.
Stock and ETF Ideas:
Our Sector Rotation model, which appropriately weights Outlook, Bull, and Bear scores in accordance with the overall market’s prevailing trend (bullish, neutral, or defensive), now reflects a neutral bias and suggests holding Technology, Utilities, and Consumer Goods (Staples/Noncyclical), in that order. (Note: In this model, we consider the bias to be neutral from a rules-based trend-following standpoint when SPY is between its 50-day and 200-day simple moving averages.)
Other highly-ranked ETFs in SectorCast from the Technology, Utilities, and Consumer Goods (Staples/Noncyclical) sectors include First Trust Nasdaq Technology Dividend Index Fund (TDIV), Utilities Select Sector SPDR Fund (XLU), and PowerShares S&P SmallCap Consumer Staples Portfolio (PSCC).
If you prefer to take a bullish bias, the Sector Rotation model suggests holding Technology, Energy, and Financial, in that order. On the other hand, if you prefer a defensive stance on the market, the model suggests holding Utilities, Consumer Goods (Staples/Noncyclical), and Healthcare, in that order.
Disclosure: Author has no positions in stocks or ETFs mentioned.
Disclaimer: This newsletter is published solely for informational purposes and is not to be construed as advice ...
more

