
Stocks Breaking Higher, New Uptrend Or Still Just Consolidation?
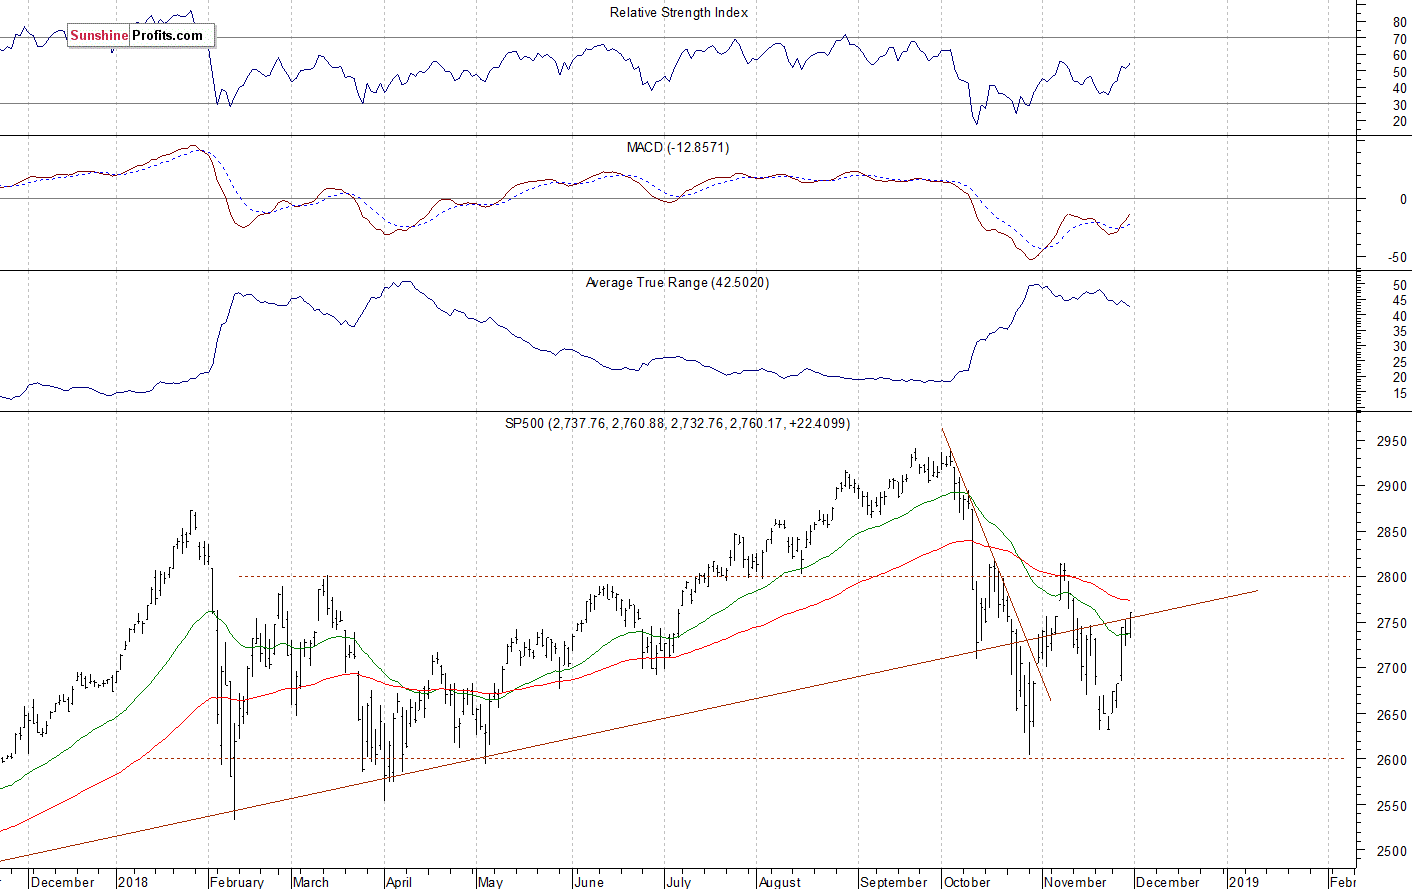
The U.S. stock market indexes gained 0.8%% on Friday, as investors' sentiment remained bullish following the recent advance. The S&P 500 index broke above the level of 2,750, and it currently trades 6.1% below September the 21st record high of 2,940.91. Both the Dow Jones Industrial Average lost and the Nasdaq Composite gained 0.8% on Friday.
The nearest important level of resistance of the S&P 500 index is now at 2,800-2,815, marked by the early November local highs. The next resistance level is at 2,860-2,900, marked by some previous fluctuations. On the other hand, the support level is at 2,750, marked by the previous level of resistance. The support level is also at 2,700-2,720.
The broad stock market got closer to its late October low a week ago. The S&P 500 index traded more than 10% below the record high. But it was a bottoming pattern before an upward reversal. The market is at the long-term upward trend line again and it may get back above 2,800 mark. So will the uptrend continue? For now, it still looks like a two-month-long consolidation following the October rout:
(Click on image to enlarge)
Very Positive Expectations
Expectations before the opening of today's trading session are positive, because the index futures contracts trade 1.3-2.1% above their Friday's closing prices. The European stock market indexes have gained 1.0-2.3% so far. Investors will wait for some economic data announcements today: ISM Manufacturing PMI, Construction Spending. There will also be some speeches from the FOMC Members. The broad stock market will likely accelerate its uptrend today. We may see an attempt at breaking above 2,800 mark following an overnight U.S. - China trade tariffs talks. There have been no confirmed negative signals so far. However, we will likely see some short-term overbought conditions.
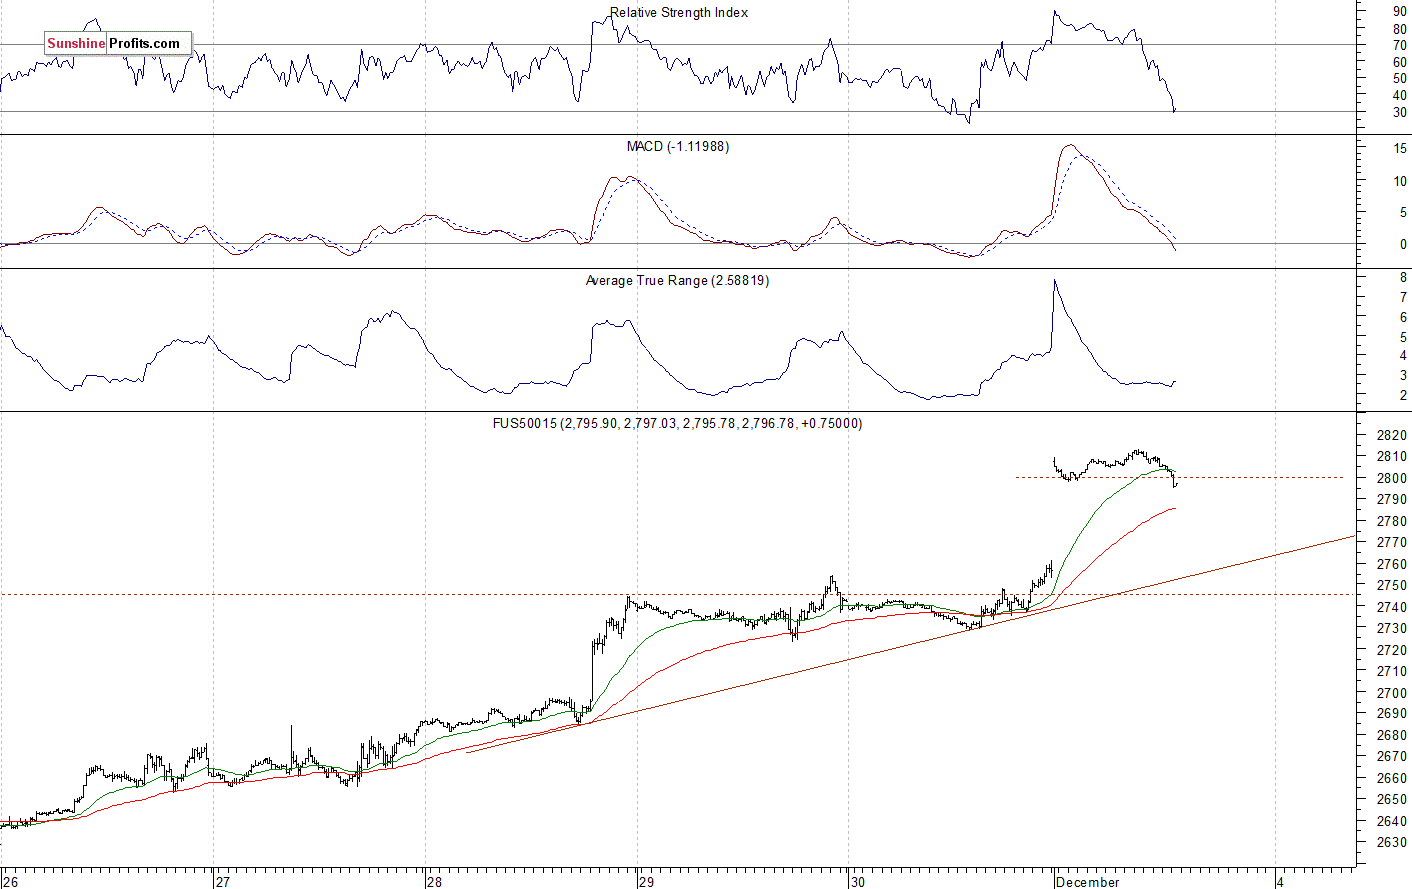
The S&P 500 futures contract trades within an intraday consolidation following an overnight rally. The market trades along the level of 2,800. The nearest important level of resistance is at around 2,810-2,815. On the other hand, the support level is at 2,790-2,795, marked by the local low. The support level is also at 2,760. The futures contract remains within a relatively narrow intraday trading range so far:
(Click on image to enlarge)
Nasdaq Also Much Higher
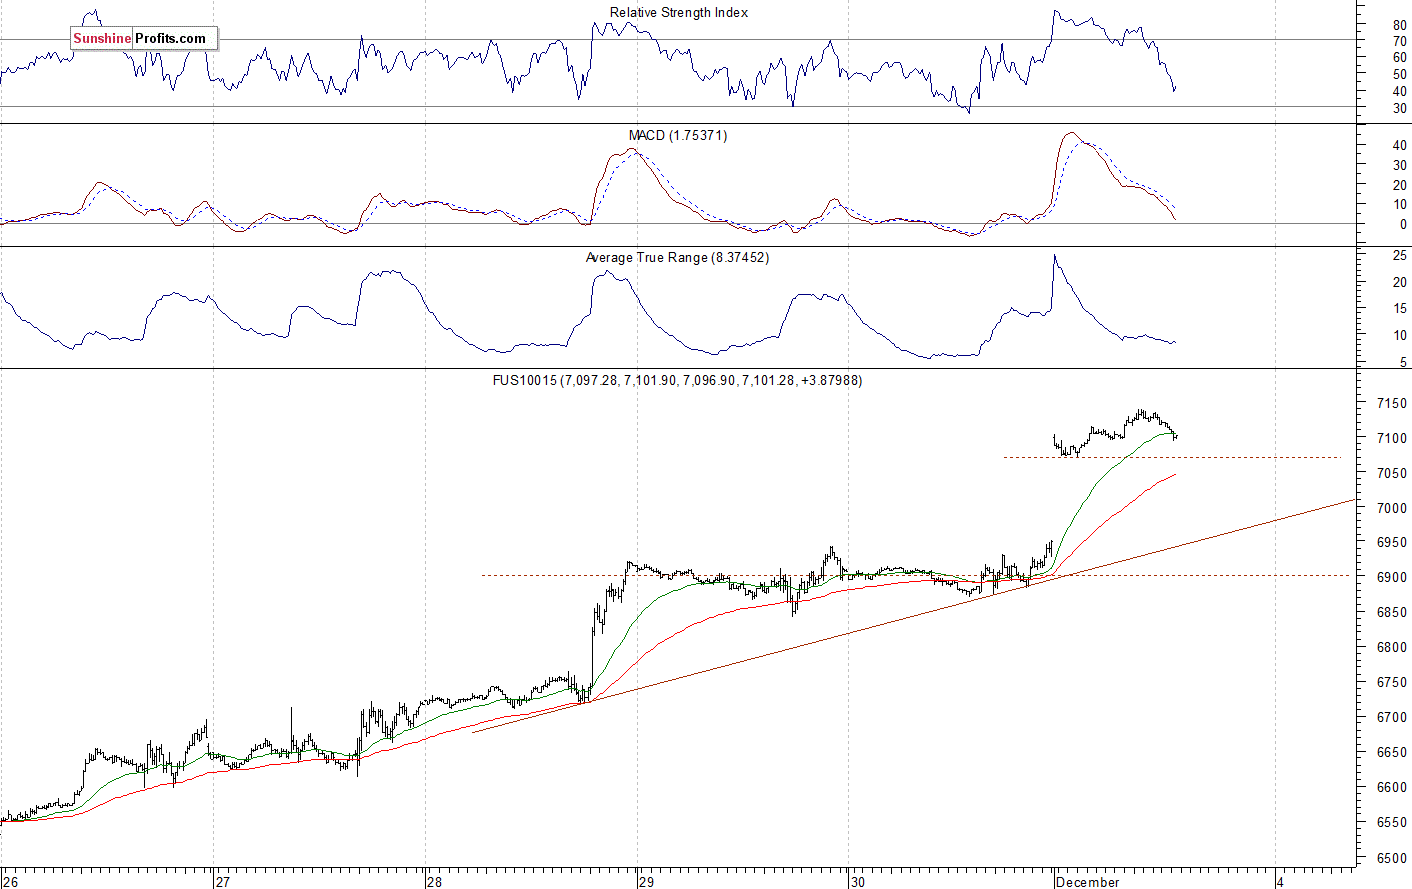
The technology Nasdaq 100 futures contract follows a similar path, as it fluctuates following an overnight rally. The market broke above the level of 7,000 and it is the highest since the early November. The nearest important level of resistance is now at around 7,150-7,200. The next resistance level is at 7,230, marked by the previous local high. On the other hand, the level of support is at 6,950-7,000, among others. The Nasdaq futures contract trades along the level of 7,100 this morning, as we can see on the 15-minute chart:
(Click on image to enlarge)
Apple, Amazon - Short-Term Uptrend
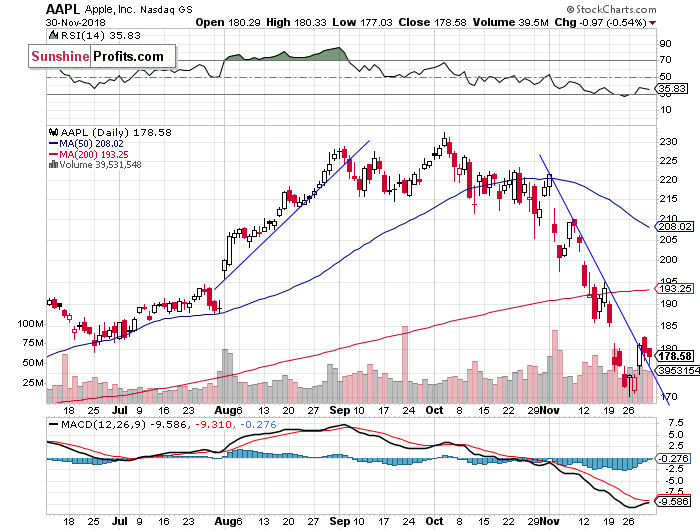
Let's take a look at Apple, Inc. stock (AAPL) daily chart (chart courtesy of http://stockcharts.com). The stock accelerated its sell-off more than a week ago following the earlier breakdown below the support level of $185-190. The market has reached a short-term bottom of around $170-175. It rallied on Wednesday and on Thursday, as it closed slightly above the month-long downward trend line. It may continue higher today:
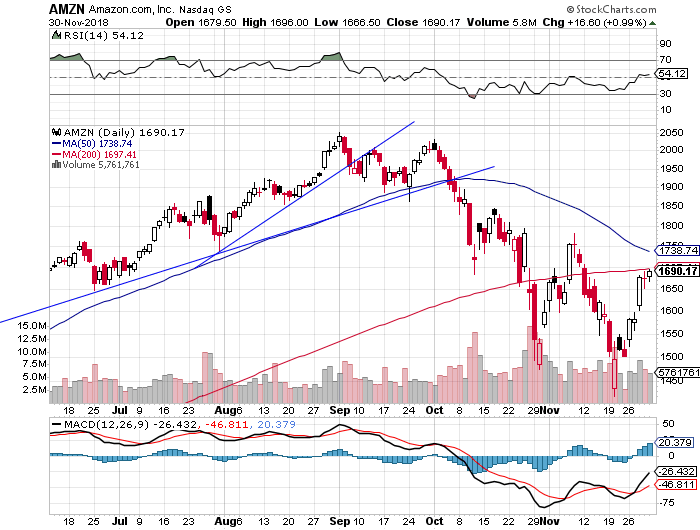
Now let's take a look at Amazon.com, Inc. stock (AMZN) daily chart. It was relatively stronger recently, as it retraced some more of the recent sell-off. Earlier, the stock fell closer to the price of $1,400, before rebounding off the support level. Then the market got back above the resistance level of $1,500, and it accelerated higher last week. The nearest important resistance level is now at $1,700-1,800, marked by some previous local highs:
Dow Jones Going to 26,000 Mark Again?
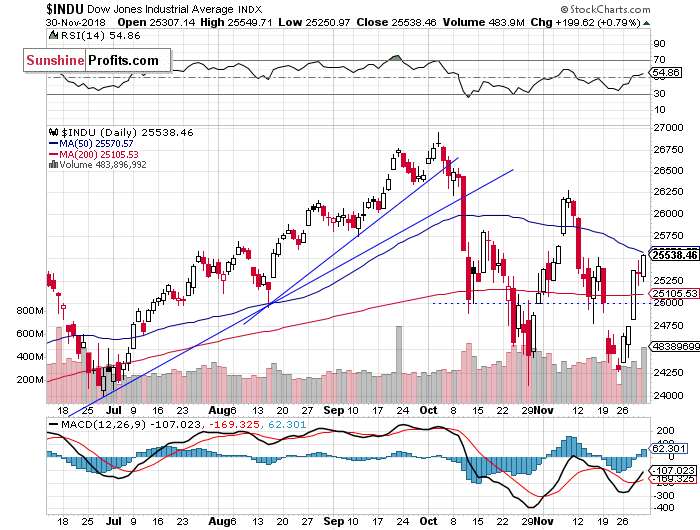
The Dow Jones Industrial Average broke above 25,000 mark last week, as it accelerated its short-term uptrend. The market got back to the resistance level of around 25,500, marked by the mid-November local highs. Now it may continue towards the early November highs of 26,000-26,250. However, it still looks like a volatile consolidation following the October sell-off:
Japanese Nikkei Gaps Higher Today
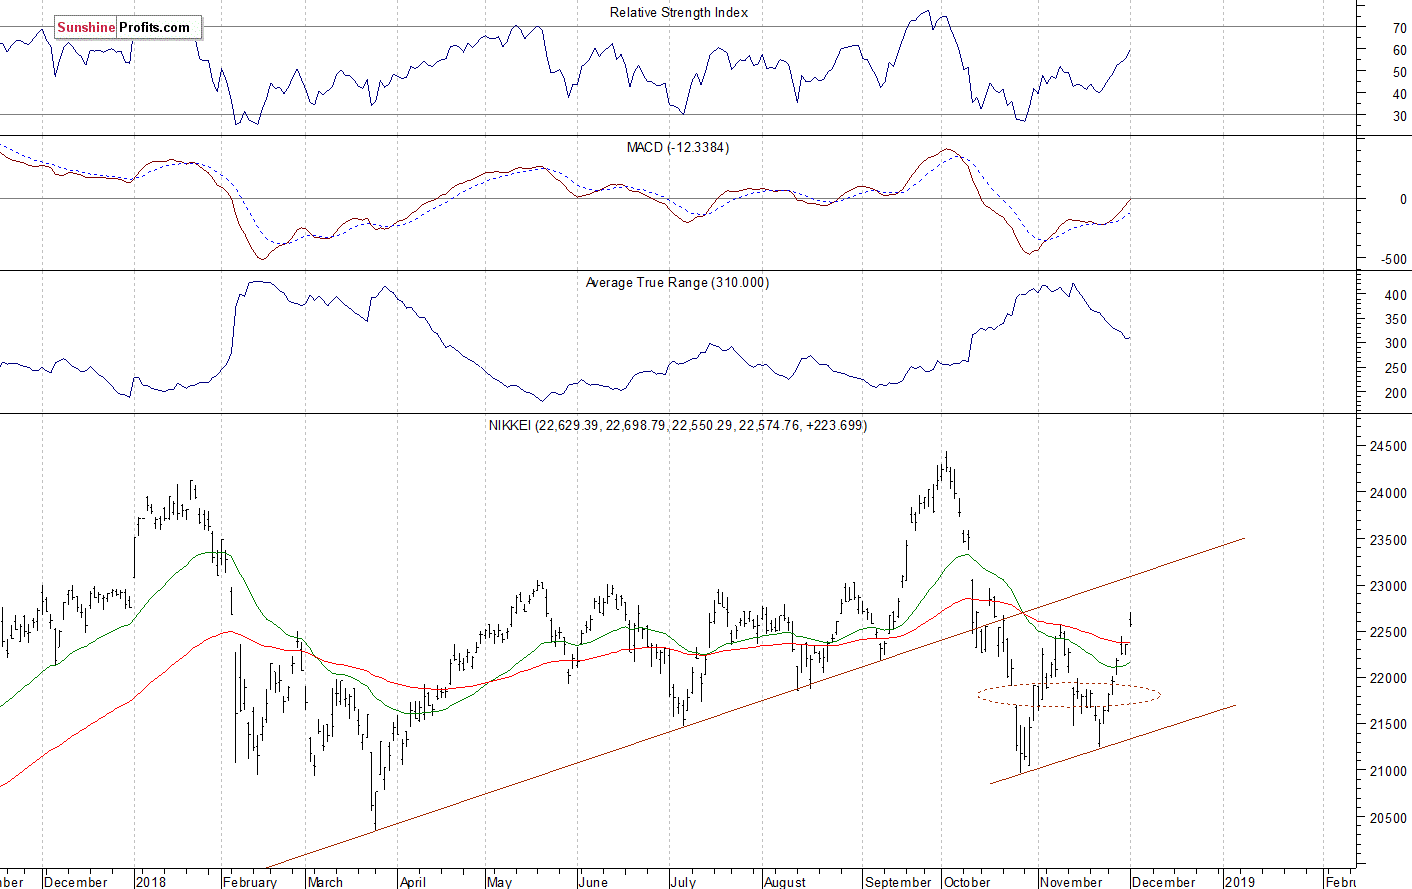
Let's take a look at the Japanese Nikkei 225 index. It broke above its early November local high of around 22,580 today. However, it remains below the broken long-term upward trend line. For now, it looks like an upward correction or some bear flag pattern within a medium-term downtrend:
(Click on image to enlarge)
The S&P 500 index accelerated its short-term uptrend last week after breaking above its week-long trading range and the resistance level of 2,700. For now it looks like an upward correction or an advance within almost two-month long consolidation. There have been no confirmed short-term negative signals so far.
Concluding, the S&P 500 index will likely open much higher today. We will likely see an attempt of breaking above 2,800 mark again following the U.S. - China trade tariffs talks. But we could see some short-term volatility.
Disclosure: None.


