
Stocks Breaking Higher, But Resistance Ahead
The U.S. stock market indexes gained 2.1-2.6% on Wednesday, breaking above the short-term consolidation, as investors' sentiment improved following the U.S. Elections. The S&P 500 index was 11.5% below September the 21st record high of 2,940.91 on last week's Monday. And now it trades just 4.3% below the all-time high. The Dow Jones Industrial Average gained 2.1% and the Nasdaq Composite gained 2.6% yesterday.
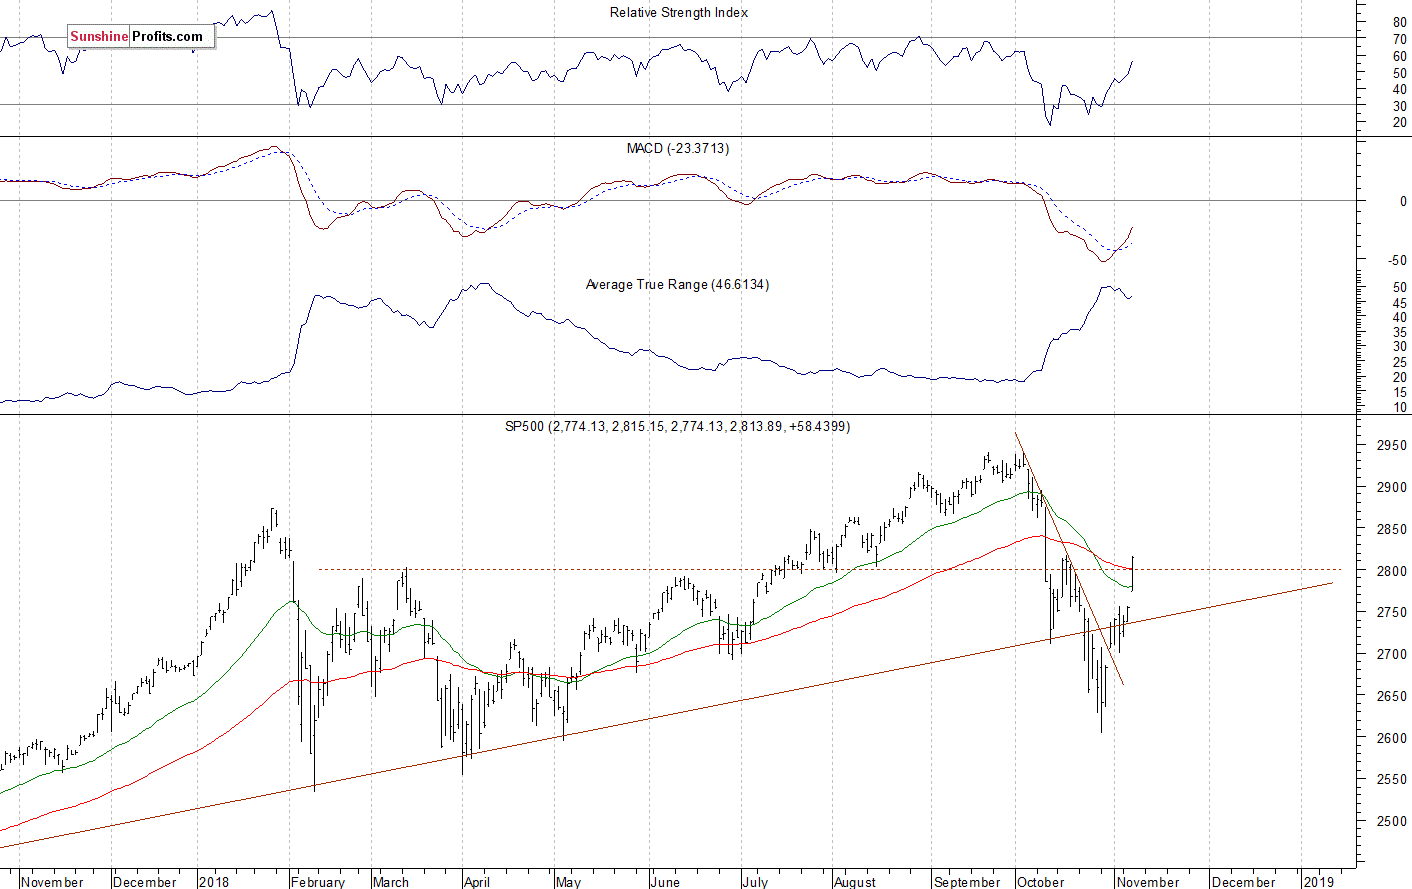
The nearest important level of resistance of the S&P 500 index is now at around 2,815-2,820, marked by mid-October local high of 2,816.94. The next resistance level is at 2,860-2,865, marked by the previous local lows. On the other hand, the support level is now at 2,780-2,800, marked by the recent resistance level. The support level is also at 2,755-2,775, marked by yesterday's daily gap up of 2,756.82-2,774.13.
The broad stock market extended its downtrend more than a week ago, as the S&P 500 index fell closer to 2,600 mark. Then it bounced sharply and accelerated higher on Wednesday. Yesterday we wrote that if the index breaks above 2,750, we could see more buying pressure. And the market got back above the broken long-term upward trend line. It is also back above 2,800 mark again. However, the index is at its mid-October local high. Will it continue higher? Well, it still looks like an upward correction following the October sell-off:
(Click on image to enlarge)
Negative Expectations, Just Consolidation?
Expectations before the opening of today's trading session are negative, because the index futures contracts trade 0.3-0.6% below their Wednesday's closing prices. The European stock market indexes have been mixed so far. Investors will wait for some economic data announcements today: Initial Claims at 8:30 a.m., the FOMC Statement - Federal Funds Rate Decision at 2:00 p.m. The broad stock market will likely fluctuate following yesterday's rally. We may see some increased volatility after the Fed's Rate Decision release. The S&P 500 index will probably trade within a consolidation along the level of 2,800.
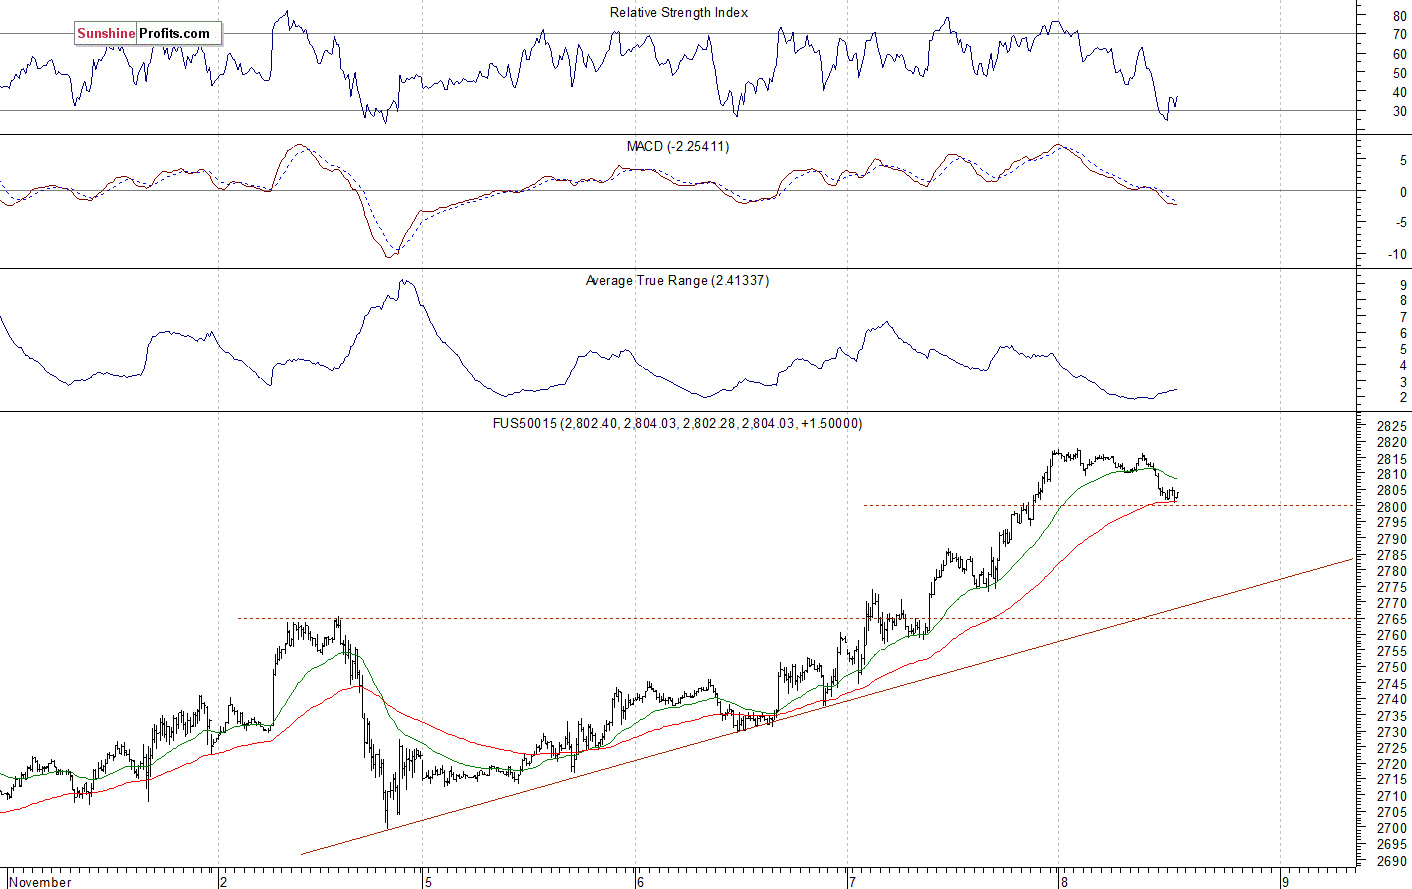
The S&P 500 futures contract trades within an intraday consolidation following yesterday's advance. The nearest important level of resistance is now at around 2,815, marked by the short-term local highs. On the other hand, the support level is at 2,780-2,800, marked by the previous resistance level. The futures contract trades very close to 2,800 mark, as the 15-minute chart shows:
(Click on image to enlarge)
Nasdaq Pauses After Rally
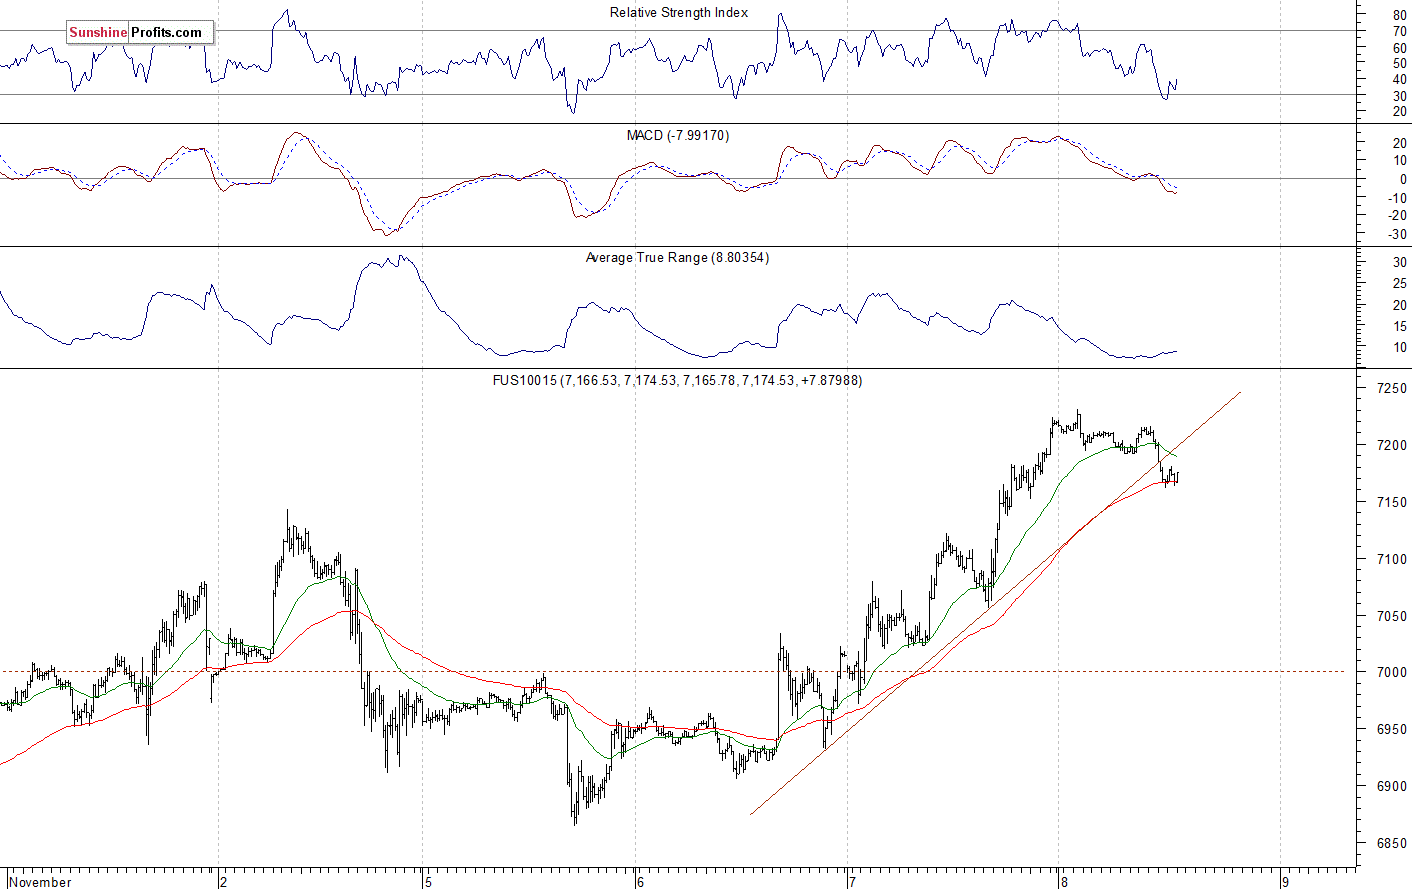
The technology Nasdaq 100 futures contract follows a similar path, as it trades within an intraday consolidation. The market retraced some of its yesterday's rally, but it continues to trade close to 7,200 mark. The nearest important level of resistance is at around 7,200-7,230. On the other hand, the support level is at 7,100-7,150, among others. The Nasdaq futures contract trades along its short-term upward trend line, as we can see on the 15-minute chart:
(Click on image to enlarge)
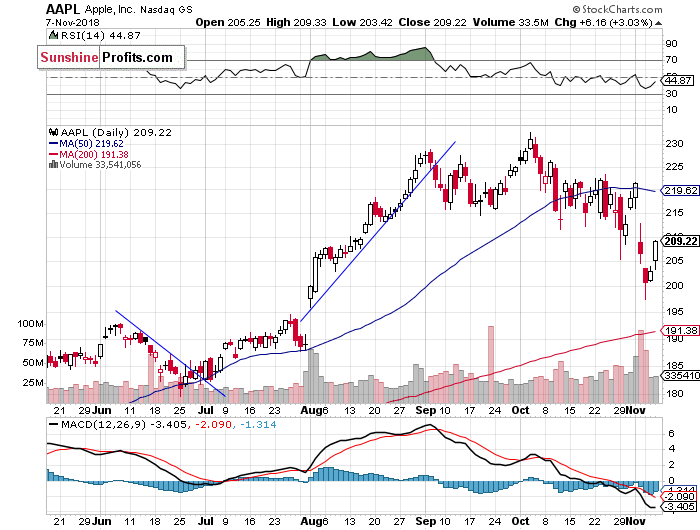
Big Cap Tech Stocks' Rebound
Let's take a look at Apple, Inc. stock (AAPL) daily chart (chart courtesy of http://stockcharts.com). It sold-off below the level of $200 on Monday, before bouncing off the support level. It was relatively weaker than the broad stock market, as investors continued to react to Thursday's quarterly earnings release. The stock fell the lowest since the early August. Yesterday the market got back to the broken support level of around $210-215. For now, it looks like an upward correction:
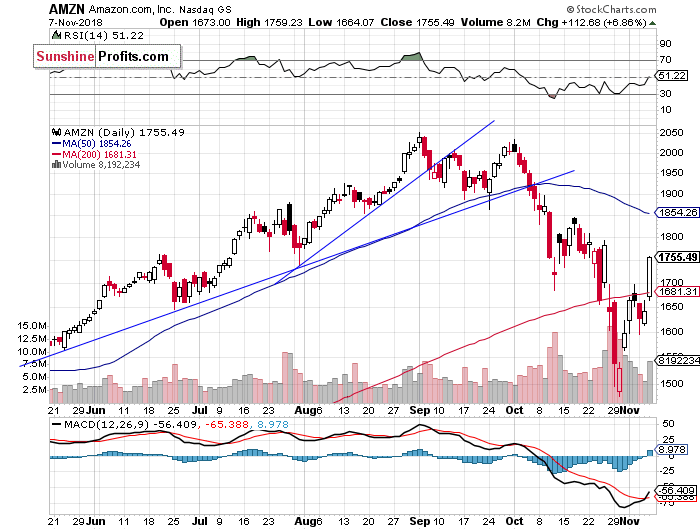
Now let's take a look at Amazon.com, Inc. stock (AMZN) daily chart. It accelerated its sell-off following the quarterly earnings release. The stock continued lower last week, but then it bounced off support level of $1,500. It accelerated higher yesterday, however, the price reached a potential resistance level of around $1,750-1,800:
Dow Jones Keeps Rallying
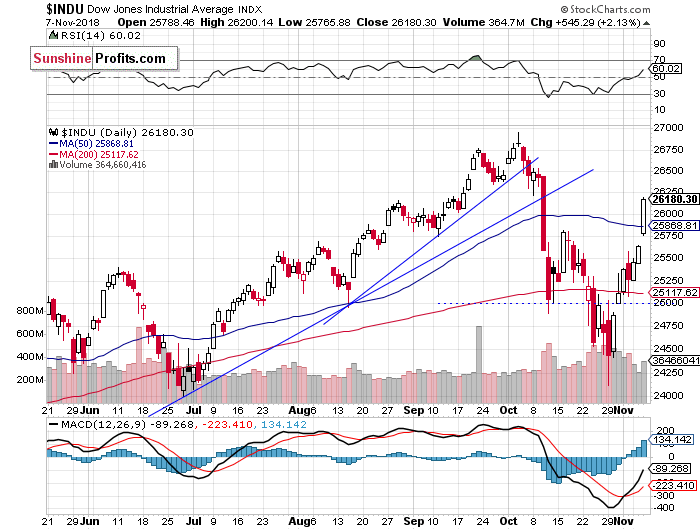
The Dow Jones Industrial Average retraced more of its recent decline yesterday. It accelerated above 26,000 mark and got closer to the early October topping consolidation. The nearest important level of resistance is now at around 26,500-27,000, marked by the record high:
Japanese Stocks Also Higher
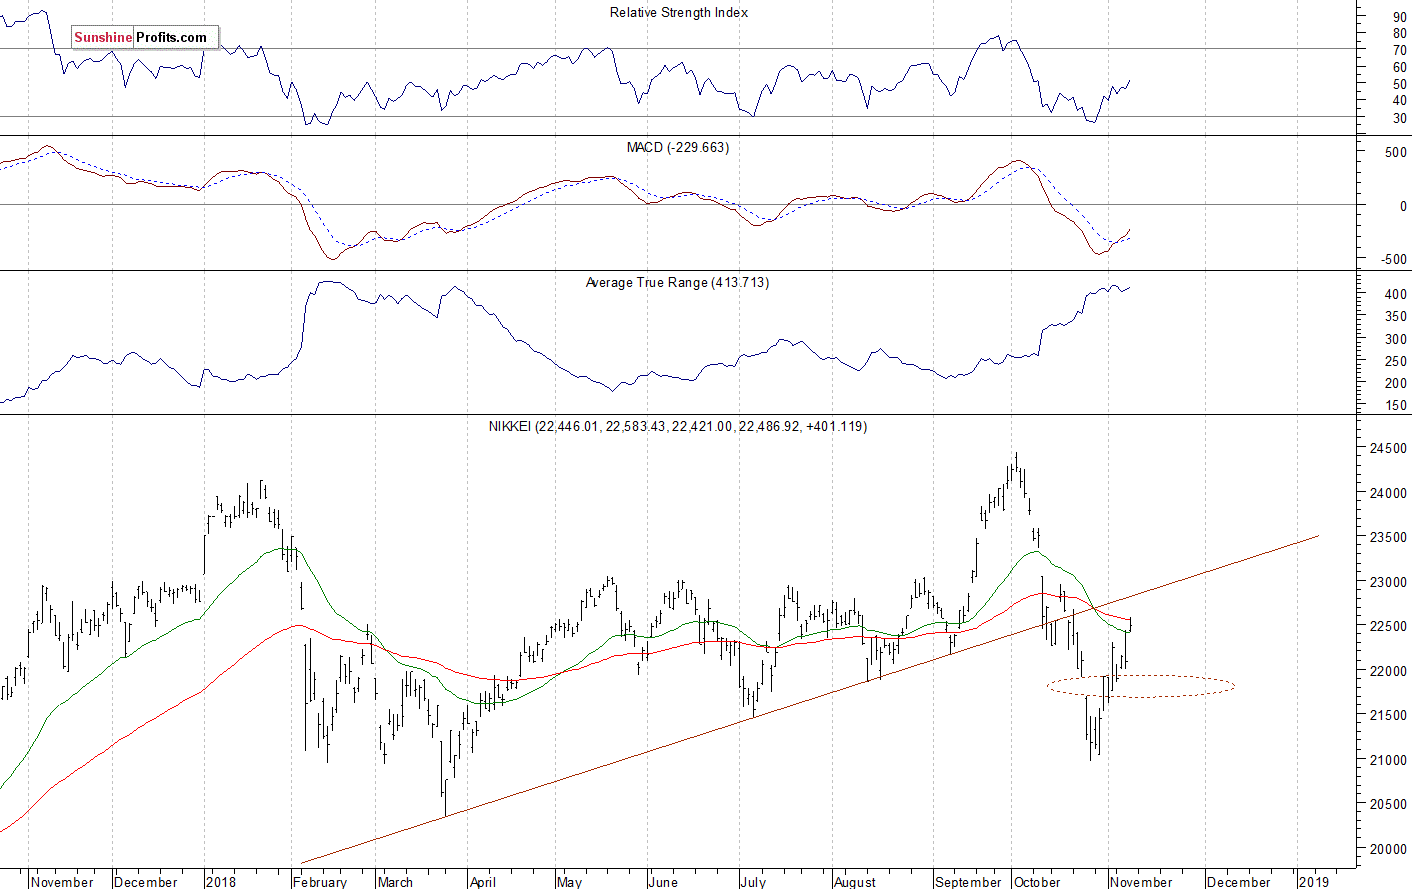
Let's take a look at the Japanese Nikkei 225 index now. It retraced more of its October sell-off today. The market got back above the resistance of October the 25th daily gap down. But for now, it looks like an upward correction within a downtrend. The Nikkei continues to trade below its broken long-term upward trend line, as the daily chart shows:
(Click on image to enlarge)
The S&P 500 index accelerated its short-term uptrend yesterday following breaking above its recent trading range. Stocks reached their short-term panic bottom a week ago on Monday. But will the uptrend continue? The market broke above the important level of resistance of 2,750-2,760 yesterday. Then it reached the resistance level of around 2,800-2,820. It will likely fluctuate along that resistance level for some time.
Concluding, the S&P 500 index will probably open lower today, as investors may take short-term profits off the table following yesterday's rally. We may see an increased volatility after the Fed's Rate Decision release at 2:00 p.m.
Disclosure: None.


