Stocks: A Little Perspective Helps
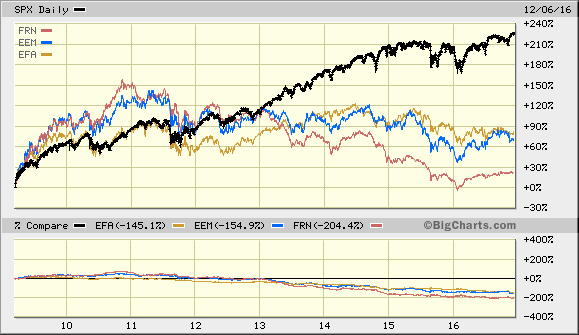
According to the US stock market, America is great already. Here is a chart from the bull market start on March 9, 2009 to the present. All data in US dollar terms.

Note how the divergence began in late 2011 when the US Fed began its excursion into unprecedented monetary policy activism.
History shows that such divergences are a worrisome indication of a disconnect between (and sometimes within) markets. Based on the principles first espoused by the Dow Theory, divergences are yellow warnings signs, which can, as the chart clearly illustrates, extend for a very long time.
Similar to market sentiment indicators, divergences are helpful in putting a current trend (either bull or bear) in perspective.
Markets do best when they move in concert with each other. Divergences, like sentiment and valuation models, are useful supplemental tools in understanding an establish market trend.
Disclosure: Accounts managed by Blue Marble Research may presently hold a long/short position in the above mentioned issues and their inverse comparables.


I really miss your excellent articles!
thanks for sharing