
Stock Market: Alternate Projection
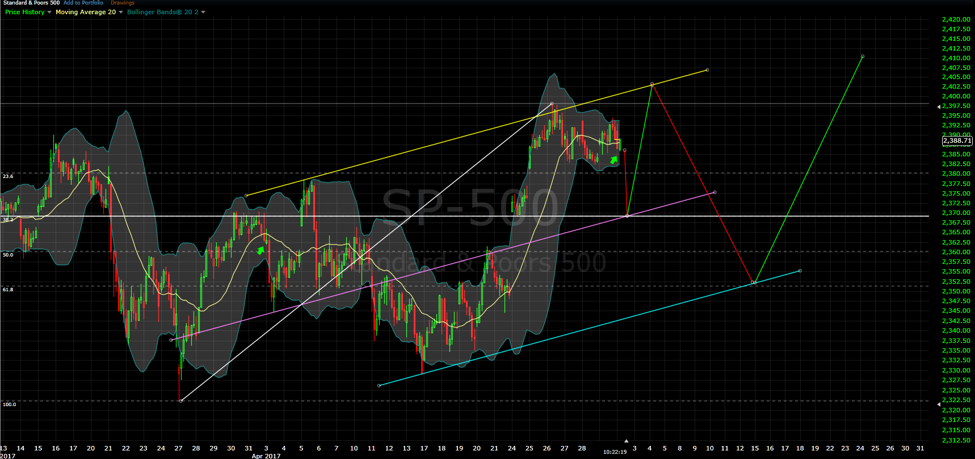
The chart below shows the alternate projection going forward for the S&P 500. This projection shows an extended 4 trading days to the normal 16 TD top (May 4th?), and also the next low due around the time of the next Bradley turn due May 11-12.May 15 is exactly 7 weeks (34 TD’s) from the 20 week low of March 27.
The .382 retracement is exactly at the point of the large gap on the chart and should hold any decline today. Either May 4th is the all important top or we see another one in late May or early June.
November 4th, 2016 to March 27th, 2017 measures 96 TD’s, just 4 TD’s shy of a perfect 100 TD’s.The 200/400 TD low is due in the summer of 2017.
(Click on image to enlarge)
Disclaimer: The information provided by the BluStar Market Timer is to be used for educational purposes only. We do not recommend the buying or selling of any securities, are not registered ...
more

