
Stock Market & Crude Oil Forecast
The SPX hit new highs and will see even higher highs! Goldman Sachs, is the latest bank to publish research, to justify the current high prices of the market and its year-end SPX price target. Goldman argues that the index can head higher to 2580 in this bull market trend.
The current rally continues to climb without a quantifiable pullback!
My proprietary technical model has now confirmed a NEW BUY SIGNAL on the SPX! This is a new signal informing us of the continuation of this rally. President Trump’s pro-business policies, along with soaring business and consumer optimism, is jet fuel for this bull market to continue even higher.
The correction is OVER and the next leg of this bull market will take the SPX to 2500+. The bears will be left with nothing, except huge losses. The call and put buying action that is reflected from the CBOE shows that the leveraged money is now on the long side of these equity markets.
In my research report that I released back on April 18th, 2017, I stated that “On a short -term basis, we are at that point where sentiment is overly ‘pessimistic’. Seasonality is turning positive and any further selling should be erased by the time when everyone pays Uncle Sam. When short-term sentiment becomes pessimistic, it creates a new BUY SIGNAL to re-enter the SPX long!”. This is exactly what occurred on May 25th, 2017.
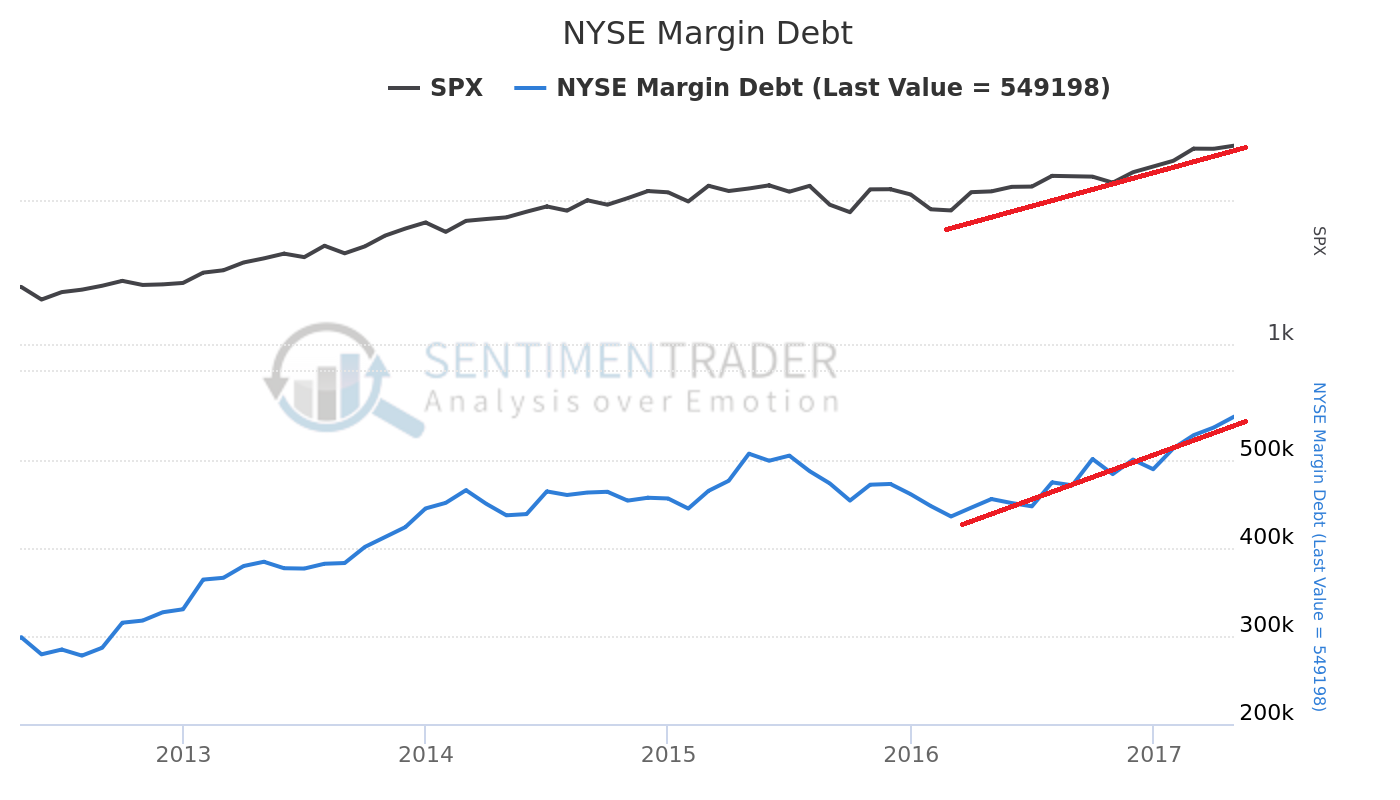
Margin Debt:
The New York Stock Exchange, (NYSE), releases data monthly, of the customers of clearing firms overseen by the NYSE. This data includes margin debt and free credit balances. As you can view, from the chart below, there is a positive correlation between margin debt and the rise of the SPX. It is now confirming that buying continues to push the SPX much higher!
Follow the Smart Money!
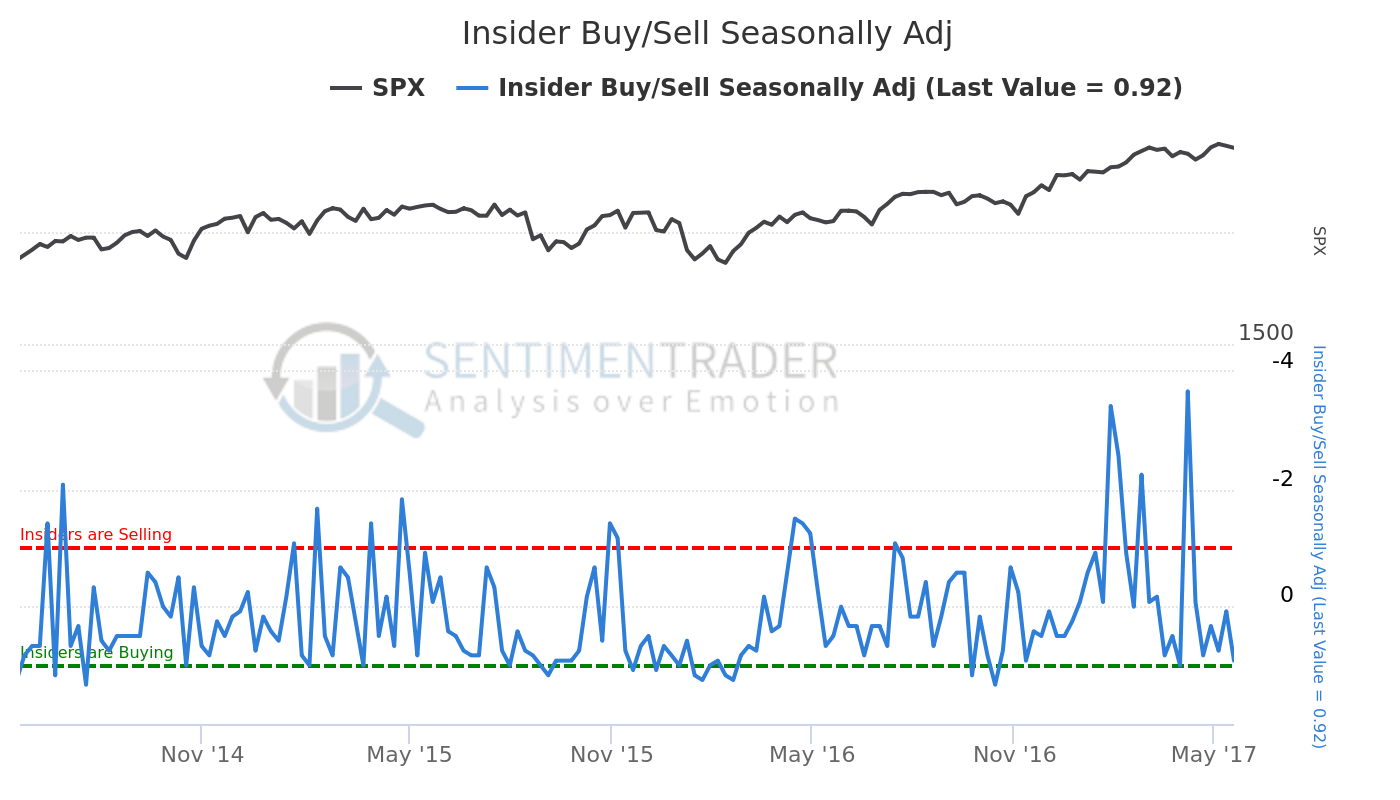
Company insiders tend to be the smart money. When there is insider buying, it is good for the markets. Buying and selling, by corporate insiders, often occurs when they believe in the future prospects of their company’s earning potential.
A proprietary ‘insider’ indicator was created to monitor the buying and selling of options. This indicator measures the net number of insiders among companies in the SPX, that sold minus bought, shares in their own companies. It looks over the past five years to determine the average level of buying or selling during that month, and adjusts the current figure based on those averages.
The bottom green line is when the insiders are buying, meaning when the blue indicator line is low it means stocks should be bottoming and can be bought based on insiders activity.
The Slippery Slope – Oil
On, Thursday May 25th, 2017, oil prices plummeted 5% after the OPEC and non-OPEC producers agreed to extend the oil output cut deal for nine months. Oil sold-off, aggressively, as market participants were expecting the cartel to announce deeper cuts to output.
I issued a trade alert, a couple of hours before the opening bell as I could see what oil what about to do next. We at TheGoldAndOilGuy.com purchased the SCO ETF which is a 2x oil ETF, which rocketed higher by 10.4% over the next few hours on May 25th which we locked in partial profits and adjusted our stop to eliminate any downside risk. Members were elated with our instant results.
Disclosure: If you want to know where the market is headed each day and week, well in advance then be sure to join my ...
more

