
SPY: “Three Drives To Top”
- SPX Monitoring purposes; Short SPX on 8/30/17 at 2457.59.
- Monitoring purposes GOLD: Neutral
- Long Term Trend monitor purposes: Neutral.
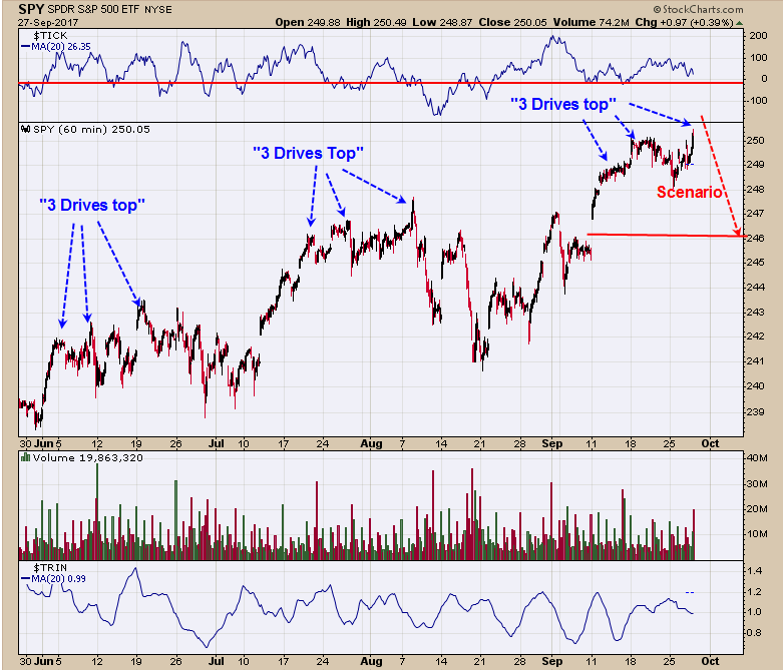
The pattern forming on the hourly chart was either a “Head and Shoulders top” or “Three Drives to Top” and yesterday we where concluding it was a Head and Shoulder pattern. Since a new high was hit today the Head and Shoulders was ruled out and the “Three Drives to Top” is front and center. Also notice that the last three highs in the SPY where all “Three Drives To Top”. Still expect a pull back to gap of September 11 near 246. A test of the September 11 gap on higher volume will suggests the gap will fail and market will continue lower. A gap test on lighter volume will suggest the gap has support, we will have to see what the volume is if and when its tested. The bigger “Three Drives to Top” that started back in June has a downside objective to 2400 on the SPX and our intermediate term target. The McClellan Oscillator hit -246 on August 10, suggesting a consolidation on average that could last two months or longer.Short SPX on 8/30/17 at 2457.59.
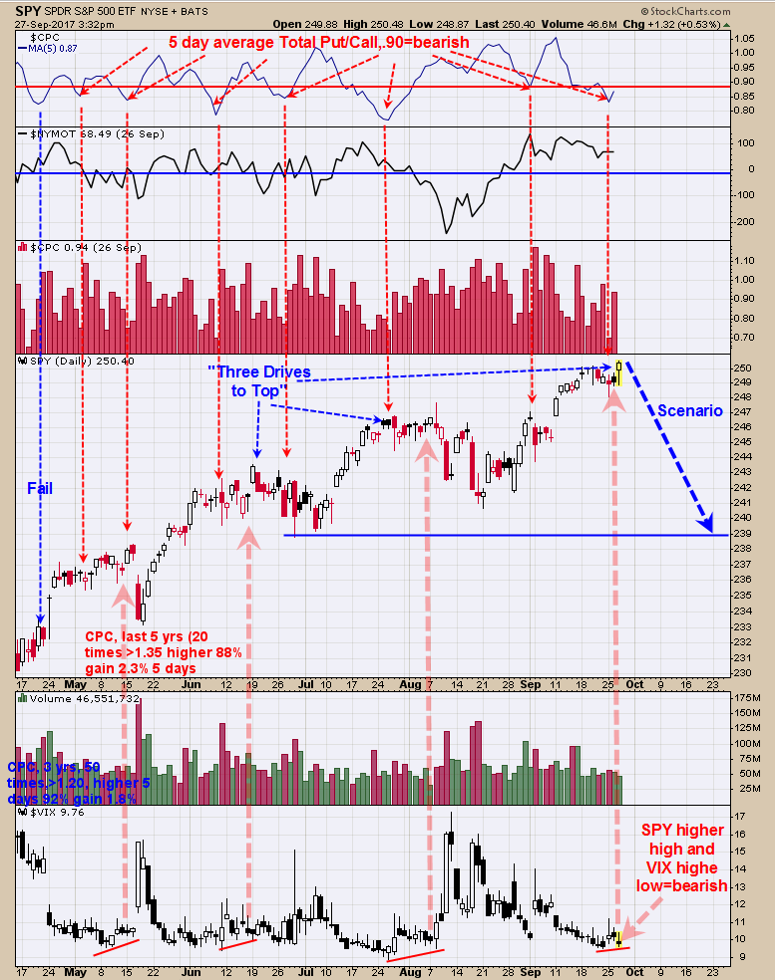
The top window is the 5 day average of the Total Put/Call ratio; readings below .90 on this ratio have appeared near short term tops. The current reading on this ratio is .87 and yesterday’s close .83. The bottom window is the VIX. In general the VIX moves opposite of the SPY and when there is a divergence, a reversal is possible. Today the SPY touched a new high and the VIX made a higher low and a short term divergence. We have pointed out the previous divergences on the bottom window going back several months. Divergences are present and tops can take a while to form. The large “Three Drives to Top” that started back in June, we have discussed on previous reports is still in play. The current setup could lead to a potential pull back that may reach 2400 range on the SPX which is near 4%.The McClellan oscillator closed today near +66; a close below “0” would be another bearish sign. Short SPX on 8/30/17 at 2457.59.
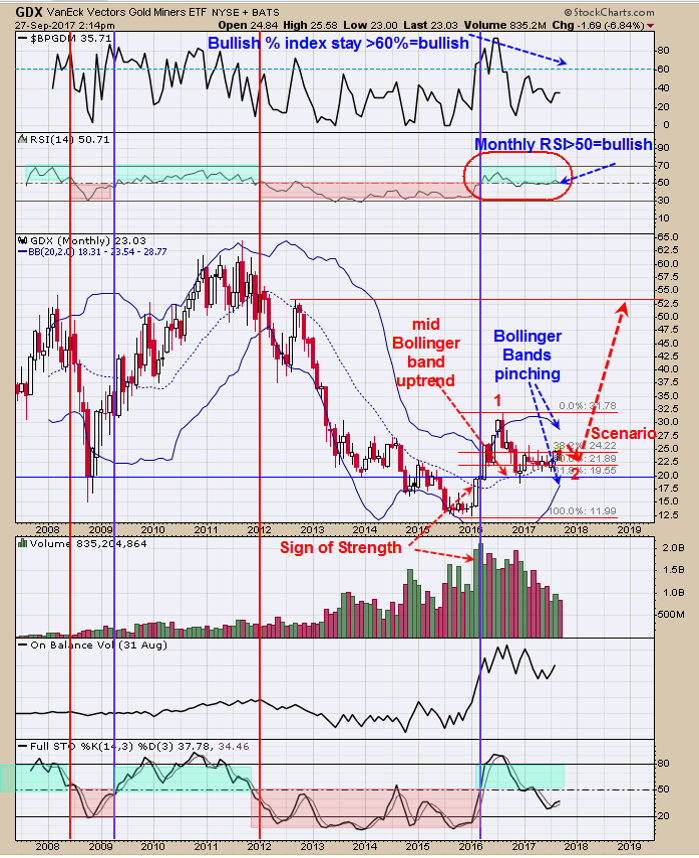
The last report for the COT Commercials came in at 253K short and the previous week at 272K short both of which are bearish. Above is the monthly GDX chart going back to 2007. The monthly Bollinger band is starting to “Pinch” suggesting a large move is not far off. There is a Cycle low due in December and maybe where this move starts.The monthly mid Bollinger band is rising and the monthly RSI is >50, suggesting GDX is in a Bullish mode. In Elliott wave terms, large “Wave one” started in January 2016 and was confirmed with a “Sign of Strength” (large volume and strong price move) and ended August 2016.Large “Wave 2” started in August 2016 and is on going and may end at the next cycle low due around December. We didn’t label it, but there appears to be a Head and Shoulders bottom forming where the Head is the December 2015 low and “Right Shoulder” is forming now. This Head and Shoulders bottom has a measured target to 53 which is also the late 2012 high and our target. There could be minor up and down swings over the next couple of month and the Bollinger band may “pinch” more. Time is running out on “Wave 2” and “Wave 3” up to begin. Next year should be a good year for gold stock. The top window is the monthly Bullish Percent index which stands at 35.71%. When the Bull run in GDX starts this index should jump to 60% or greater and something to watch for.
Disclosure: None.
Disclaimer: Signals are provided as general information only and are not investment recommendations. You are responsible for your own investment decisions. Past performance ...
more

