SPX Reclaims 2650 Level: Dead-Cat Bounce Or Higher Prices Ahead?
I last wrote about the SPX, 10YT and SPX:VIX ratio here.
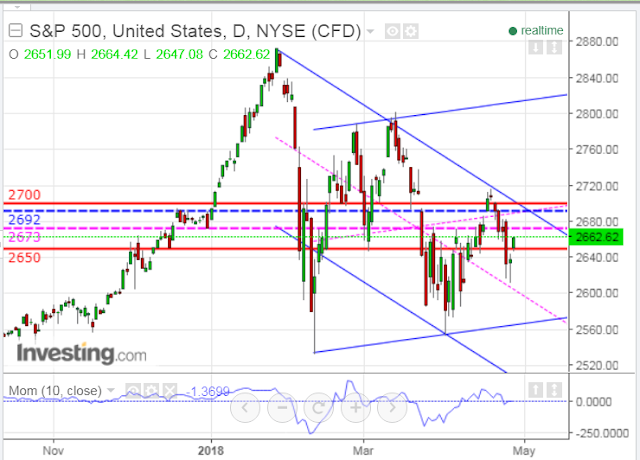
After this morning's gap up, and as at 1:00 pm ET, the S&P 500 Index (SPX) has popped back above its 2650 major resistance/support level, as shown on the following daily chart.
It's back in the red zone in between 2700 and 2650, which form major resistance and support, respectively. Near-term resistance levels are 2673 and 2692 (formed by intersecting channel lines).
The momentum indicator is still below zero, so any further rally should bring it back above that level to support further SPX strength. Otherwise, beware of a potential "dead-cat bounce" as price either stays mired in the red zone, or drops back below 2650, to, possibly, lower lows for the year.
(Click on image to enlarge)
The SPX:VIX ratio has popped back above the 150.00 Bull/Bear Line-in-the-Sand level, as shown on the following daily ratio chart.
The RSI has also popped back above the 50 level. However, the MACD and PMO indicators are showing signs of weakening, so watch for any bearish crossover, as well as a drop of the RSI back below 50 to signal rising volatility and potential sustained selling in the SPX.
(Click on image to enlarge)

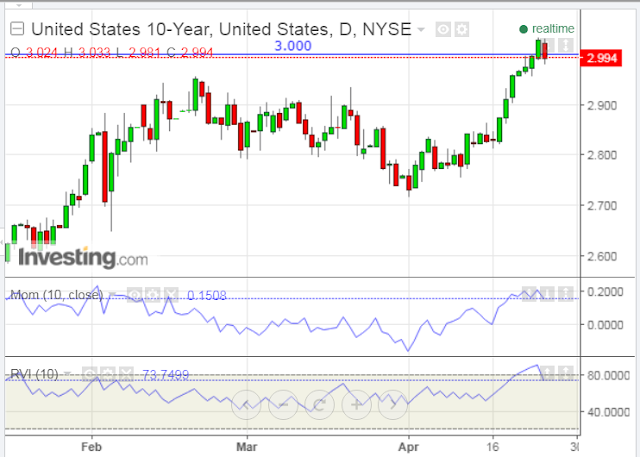
After the 10YT popped briefly above the 3% level, it has fallen back below, as shown on the following daily chart.
The recently-expanding action of the momentum and relative volatility index indicators, in both directions, reflects the increased volatility in the SPX, of late.
A break and hold above 3% could blunt any further rally in the SPX. If that happens, watch to see whether MOM and RVI produce higher swing highs to confirm its sustainability above that level.
(Click on image to enlarge)