
SPX: New Bull Market Territory Awaits
In my post of February 9th, I mentioned the importance of the World Market Index breaking, and holding above, 1750, as a potential signal of support for world equities, in the longer term, including that of the S&P 500 Index (SPX).
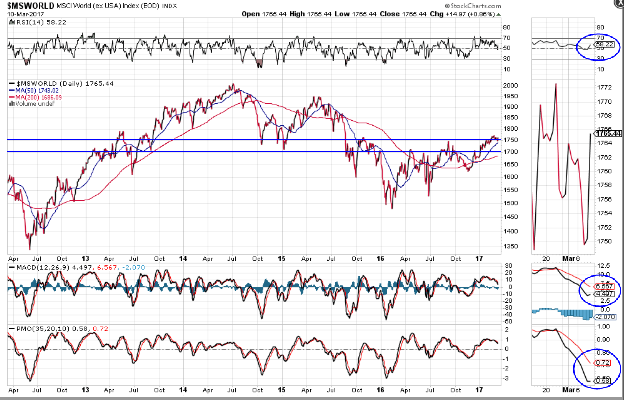
Since then, the World Market Index has, indeed, broken above and dipped back below 1750 several times, and closed out this week (March 10th) just above that level, as shown on the Daily chart below.
The RSI is in downtrend, but popped back above the 50 level, while the MACD and PMO indicators have yet to form bullish crossovers and remain in downtrend.
(Click on image to enlarge)
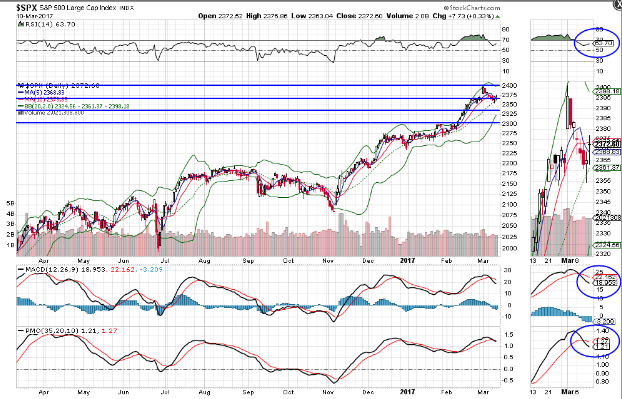
The SPX was, at the time of the above-referenced post, languishing just below 2300. It closed out this week at 2372.60, after my projected December 2017 target of 2400 was hit, 10 months early, on March 1st (see my same-day post here), as shown on the Daily chart below.
Short term resistance lies at 2400 and longer-term major support sits at 2300. At the moment, price is within the upper one-third (above 2366) of this resistance/support zone and remains above the middle Bollinger Band (2361.37) on this timeframe...favouring the bulls above these levels.
The RSI remains in uptrend and above the 50 level, while the MACD and PMO indicators have just formed a bearish crossover.
(Click on image to enlarge)
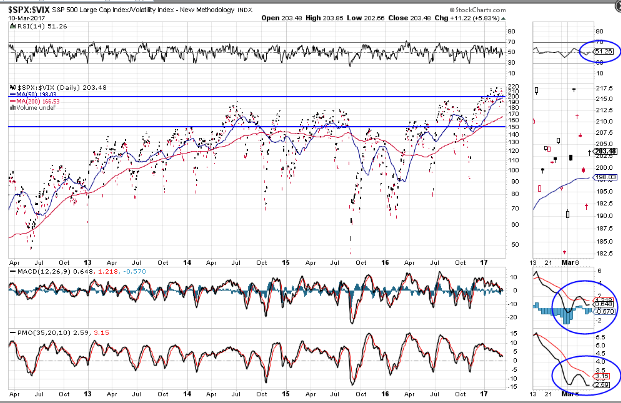
As shown on the following Daily chart, the SPX:VIX ratio has been swirling around the 200 level since January of this year and closed out the week at 203.48...favouring equity bulls. My last post on this ratio referred to this level as a new bull market territory for the SPX. So far, attempts to hold and advance much beyond this level have been short-lived...an indication that volatility is threatening to increase.
The RSI sits just above the 50 level, while the MACD and PMO indicators have yet to form a new bullish crossover, although downward momentum seems rather muted, so far.
(Click on image to enlarge)
As I mentioned on February 9th, I'd re-iterate that a longer-term sustained advancement (with conviction) of either the S&P 500 Index or the World Market Index is likely interdependent on each other's success. The important (bullish) levels to be held are 1750 for the World Market Index, 2366 for the SPX, and 200 for the SPX:VIX ratio. As well, since the technical indicators remain mixed, I'd like to see all of them form, and maintain, new bullish "BUY" signals on any such rallies.
Exactly how much of an influence U.S. political policies, Presidential executive orders, and new pieces of legislation that may be enacted, as well as forthcoming Federal Reserve rate decisions, may have on such sentiment going forward, remains to be seen. We may get a hint of that when the FOMC announces their next interest rate decision on March 15th, with future guidance and forecasts provided by the Fed Chairperson during her press conference to follow.
* UPDATE March 19th:
With price spiking up well above the 1750 major support level on the World Market Index last week, bullish crossovers have now formed on the MACD and PMO indicators, and the RSI has slightly broken above its tight downtrend with its latest push upward, as shown on the Daily chart below.
(Click on image to enlarge)
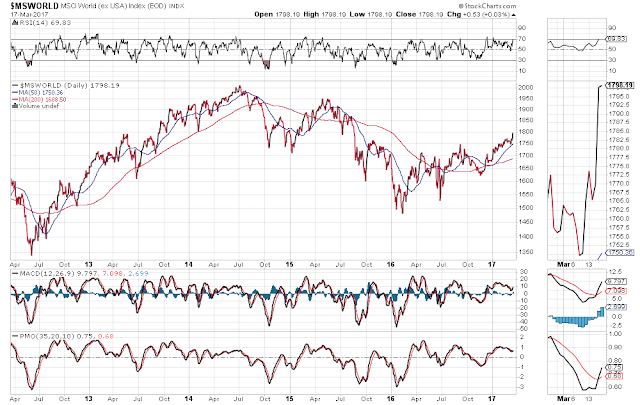
World Market Index Daily
There are, potentially, bullish signals forming on the SPX:VIX Ratio, as well, with price attempting to remain above 200, the formation of a new bullish crossover on MACD, and an imminent formation of a bullish crossover on PMO, as shown on the following Daily ratio chart. However, the RSI indicator remains muted, but remains above the 50 level...still a positive sign for equity bulls.
(Click on image to enlarge)
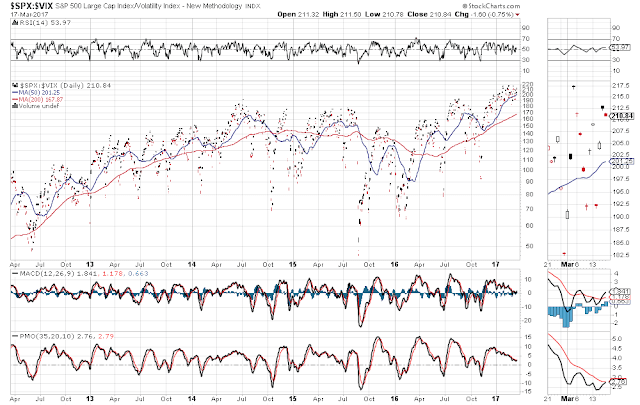
SPX:VIX Ratio Daily
We'll see, however, whether the SPX can remain above its 20-day moving average, if the above two charts firm up in bullish activity. At the moment, it's sitting just above, as shown on the Daily chart below.
*** Perhaps we'll see another push higher over the next couple of weeks, as equity fund managers look to increase, not only their end-of-month profits, but also their Q1 profits for 2017.
(Click on image to enlarge)
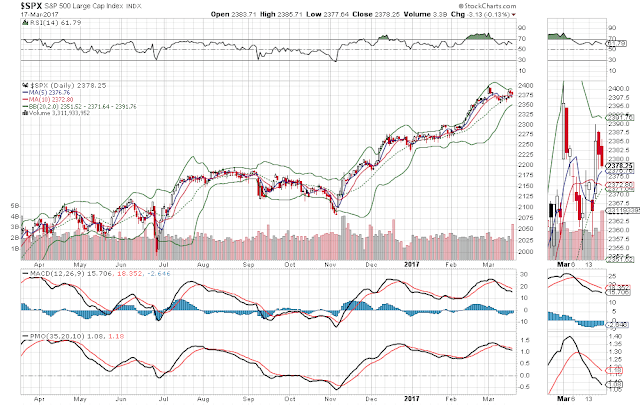
SPX Daily
Disclosure: None.


