
SPX, Gold, Oil And G6 Targets For The Week Of September 10th
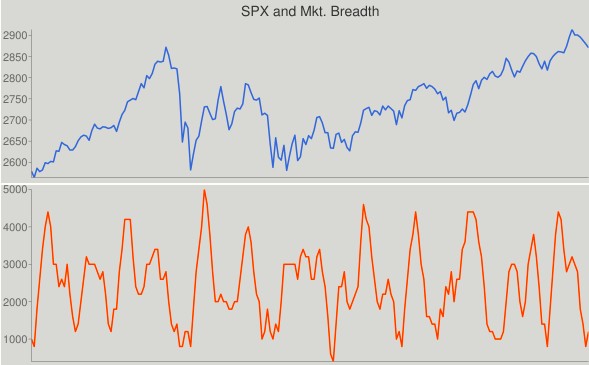
The SPX behaved in classic TA fashion and, after making a new all-time high, started September by pulling back and testing the break-out level. In doing so it finished the week just 3 points shy of our downside target and the August high. Therefore, the SPX direction this upcoming week should determine whether the market will keep its bullish trend and continue making higher highs, or whether the current downswing is more than a simple retracement, and lower prices are to follow.
The bullish case is supported by the fact that market breadth is getting oversold, thus suggesting that odds favor the beginning of a new sideways/up phase:
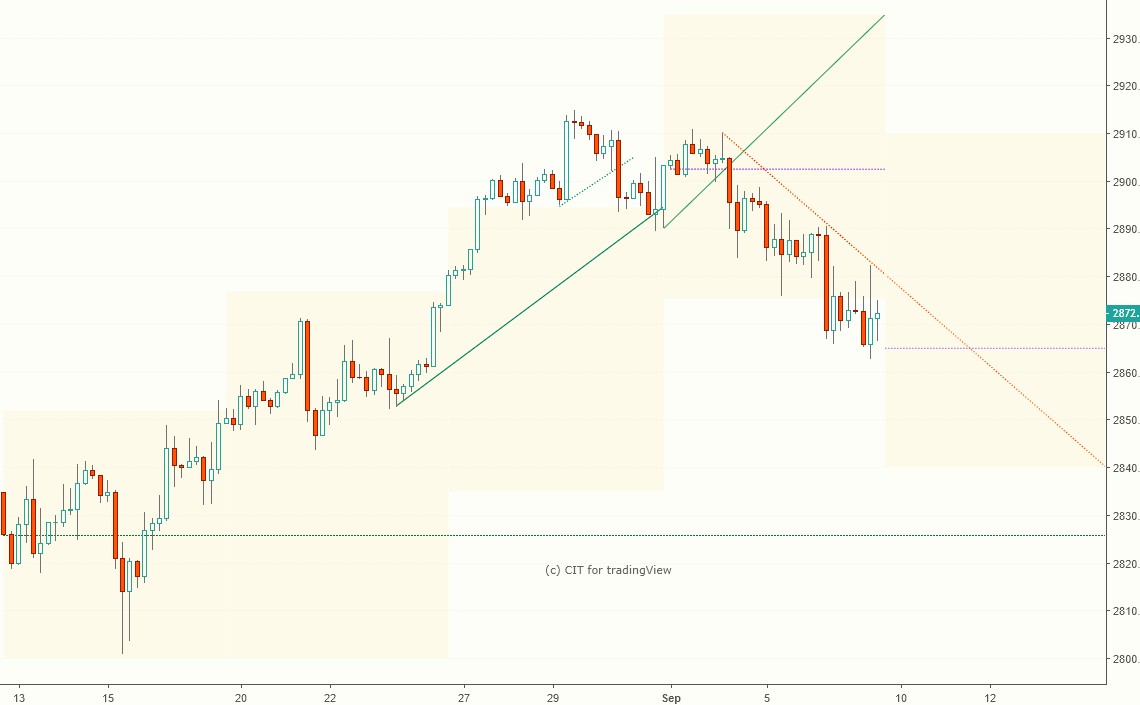
Last week we introduced a simple way to implement next week’s trading range into your work-flow by drawing target angles from recent swing highs and lows, and adjusting them as the trend progresses. In our analysis below we’ll follow the same approach by simply updating the charts with the new targets. To summarize, the rules to follow for swing traders are simple and straightforward: long above the target angle and pivot line (dotted horizontal line), short below.
In addition, paying attention to whether the target rectangle is moving up or down with regard to the previous week should provide additional clues about the direction of the weekly trend. In the case of the SPX, the weekly targets are lower compared to last week, suggesting (in addition to the break below the pivot line) that a change in trend is taking place.
Here are the monthly CIT pivots for SPX.
Pivot: 2903, S1 – 2865, S2 – 2833; R1 – 2940, R2 – 2975
The next SPX CIT date is September 11th.
The projected trading range for next week for SPX is 2840-2910:
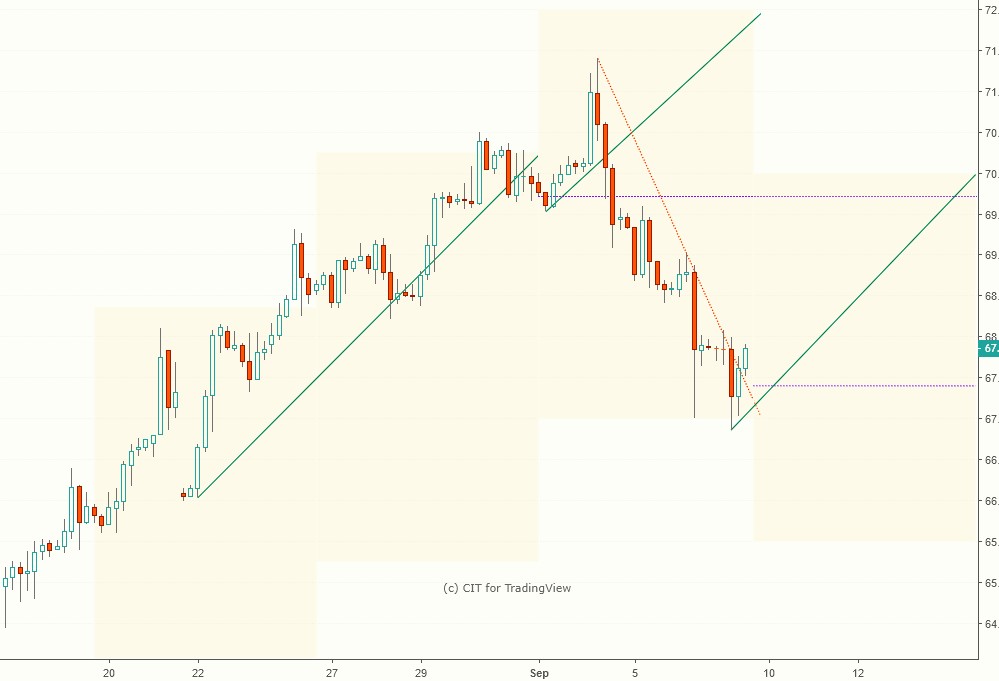
Oil retraced 62% of its bullish trend in place since mid-August and reached the projected low target, resulting in an outside weekly reversal (bearish engulfing) candle. The bounce off the low target produced a short-term counter-trend bounce which will remain in place as long as oil trades above the target angle and the pivot line.
The projected trading range for oil for next week is 65.5 – 70.
Monthly pivots: P – 69.9, S1 – 67.5, S2 – 63.3, R1 – 72.3, R2 - 74
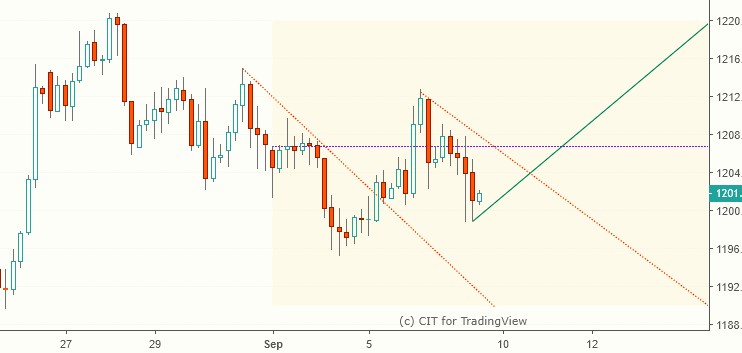
Gold traded flat bouncing around the pivot line, and the projected trading range remains the same.
Monthly pivots: P - 1205, S1 - 1180, S2 – 1160, R1 – 1230, R2 - 1250
The projected trading range for Gold for next week is 1190 - 1220:
All G6 pairs, with the exception of USDJPY, hit our targets.
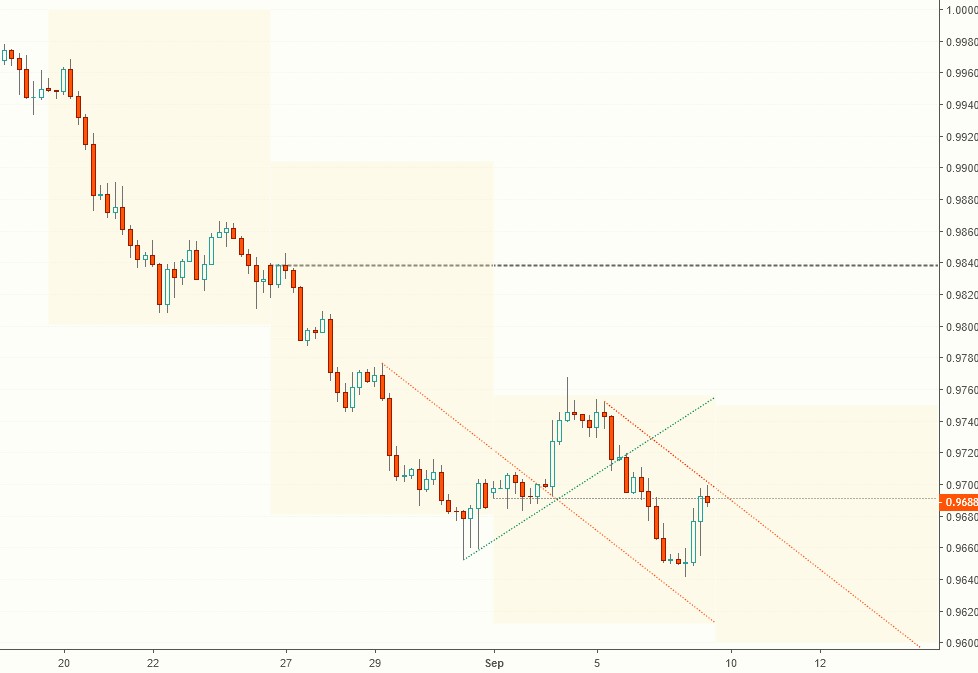
USDCHF hit our upside target and continues trying to find a bottom between the .382 and .5 retracement of the January – May upswing.
Monthly pivot at 0.97
The projected trading range for USDCHF for next week is 0.96 – 0.975:
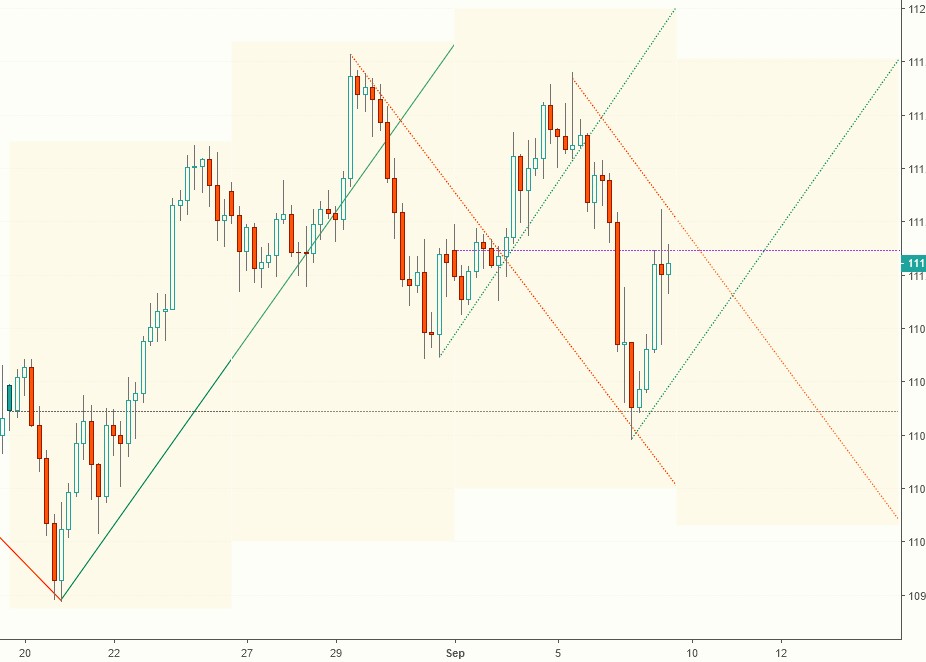
The monthly pivot acted as a magnet for USDJPY, and it couldn’t reach either our upside or downside targets.
Monthly pivot at 111.1
The projected trading range for USDJPY for next week is 110.1 – 111.8:
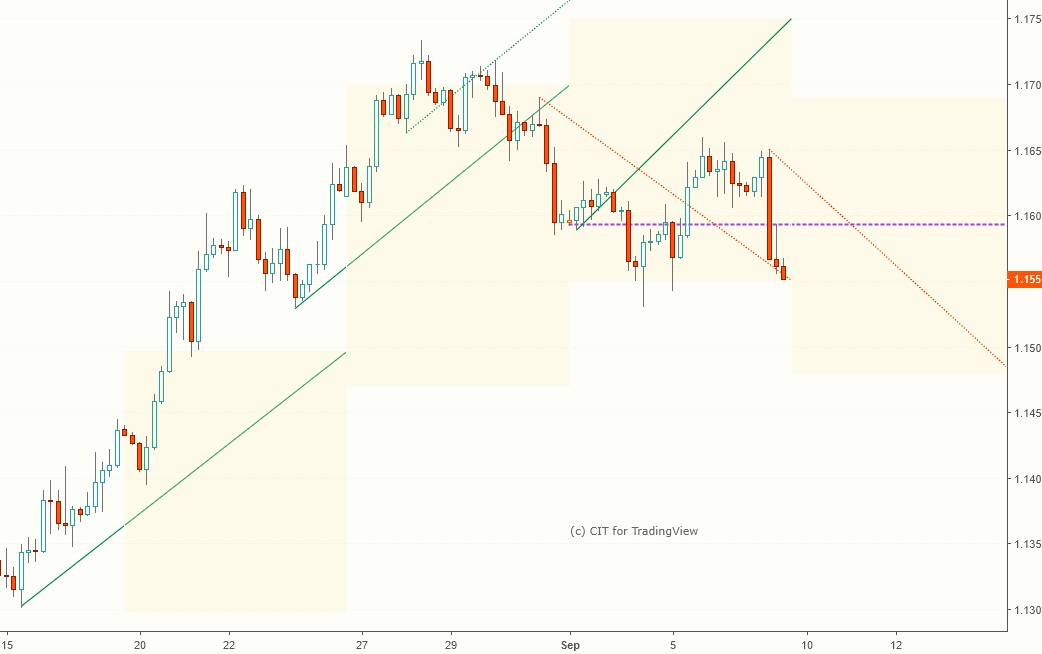
After testing it several times, EURUSD finished the week on our downside target. The projected trading range is moving lower, suggesting that the down-trend which started at the end of August hasn’t run its course yet.
Monthly pivot for EURUSD at 1.16
The projected trading range for EURUSD for next week is 1.148 – 1.169:
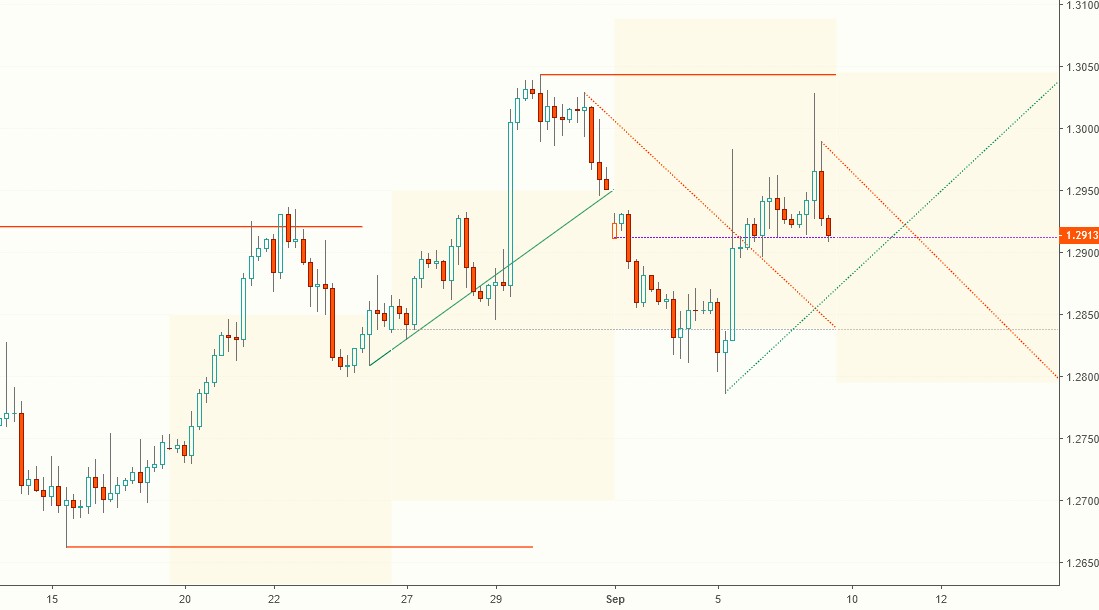
GBPUSD tested the downside target several times, bounced and finished the week exactly on the Pivot line.
The monthly pivot line is at 1.29.
The projected trading range for GBPUSD for next week is 1.278 – 1.302:
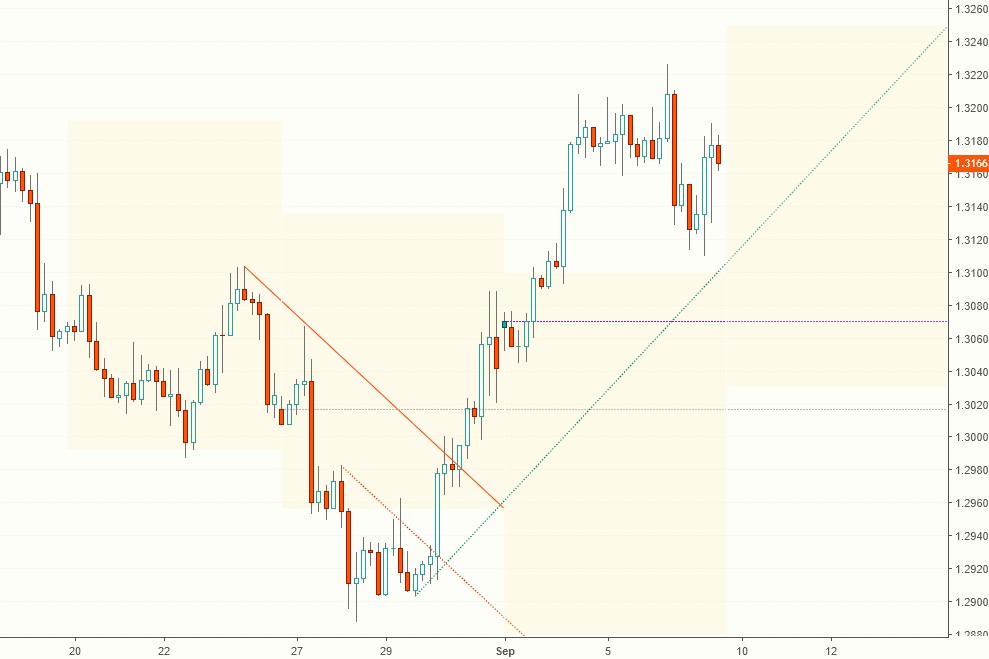
The USDCAD bullish trend remains in place, as the pair continues trading above the bullish target angle.
Monthly pivot at 1.307
The projected trading range for USDCAD for next week is 1.303 – 1.325:
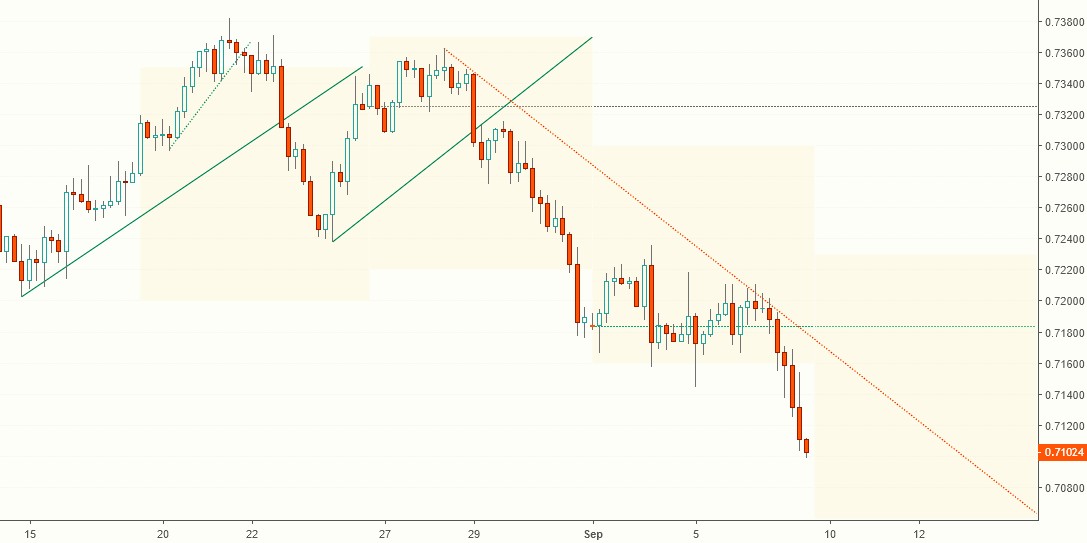
AUDUSD tested the downside target several times during the week, and finally broke below it on Friday. As mentioned before, the long-term weekly trend is sharply down, and the lower projected targets continue pointing in the same direction.
Monthly pivot line at 0.7184.
The projected trading range for AUDUSD for next week is 0.706 – 0.723:
Charts, signals and data courtesy of OddsTrader, CIT for TradingView and NinjaTrader 8
Disclaimer:Futures and forex trading contains substantial risk and is not for every investor. An investor could potentially lose all or more than the initial investment. Risk capital is money that ...
more

