
Spansion - Chart Of The Day
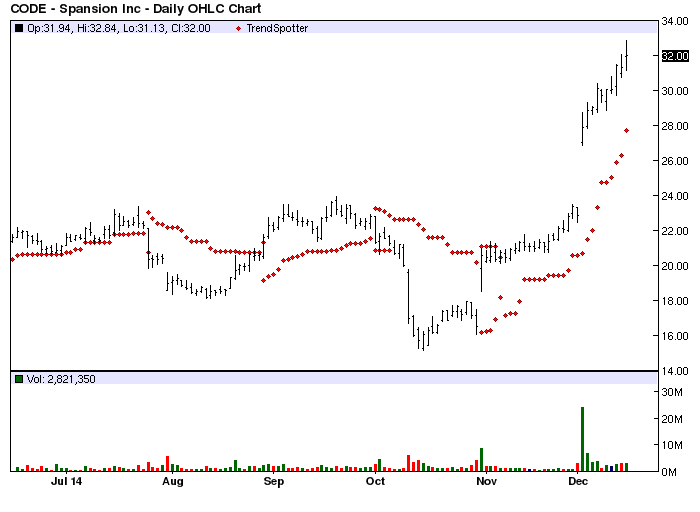
The Chart of the Day belongs to Spansion (NYSE:CODE). I found the semiconductor company when I sorted the All Time High list for the stocks with the most frequent new highs then used the Flipchart feature to review the charts. Since the Trend Spotter signaled a buy on 10/31 the stock shot up 55.49%.
Spansion Inc., headquartered in Sunnyvale, California, is engaged in designing, developing, manufacturing, marketing, and selling Flash memory solutions. Flash memory is used in nearly every electronic device including cars, printers, networking equipment, set-top boxes, high-definition TVs, games, cell phones and other consumer electronics. The Company's patented MirrorBit' technology forms the foundation for enabling Flash memory solutions optimized for both code execution and data storage. Spansion also offers total Flash memory solutions that incorporate software, hardware, packaging and are verified and compatible with third-party silicon.
Barchart's Opinion trading systems are listed below. Please note that the Barchart Opinion indicators are updated live during the session every 10 minutes and can therefore change during the day as the market fluctuates. The indicator numbers shown below therefore may not match what you see live on the Barchart.com web site when you read this report.
Barchart technical indicators:
- 96% Barchart technical buy signals
- Trend Spotter buy signal
- Above its 20, 50 and 100 day moving averages
- 15 new highs and up 51.80% in the last month
- Relative Strength Index 85.25%
- Barchart computes a technical support level at 30.02
- Recently traded at 32.00 with a 50 day moving average of 21.66
Fundamental factors:
- Market Cap $1.96 billion
- P/E 76.63
- Revenue expected to grow 28.40% this year and anther 4.20% next year
- Earnings estimated to increase 28.90% this year, an additional 87.82% next year and continue to compound at an annual rate of 39.75% for the next 5 years
- Wall Street analysts issued 2 strong buy and 7 buy recommendations on the stock
The 50 day parabolic time/price technical indicators has been an extremely good technical trading indicator on this stock and should be used as an exit point.
Disclosure: None


