
S&P Vs. T-Bill/10yr Rate Spread Update
“Davidson” submits:
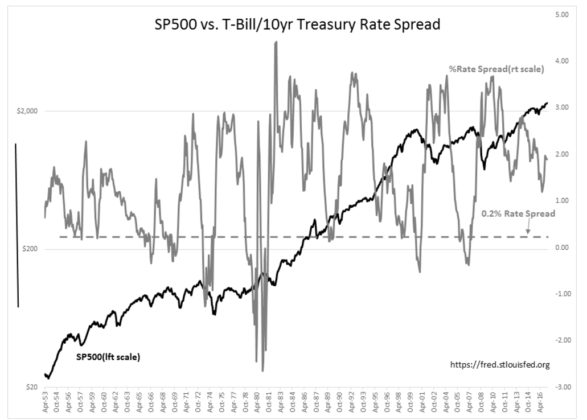
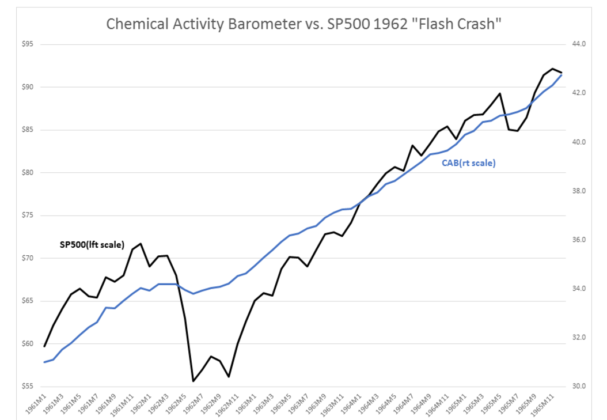
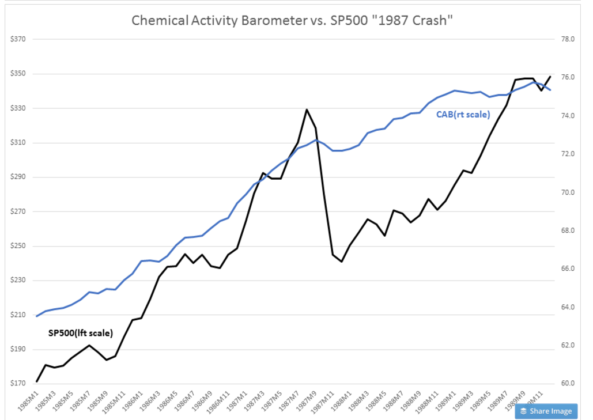
I refined the 0.0% T-Bill/10yr Treas rate spread as an indicator preceding economic correction. The level is closer to 0.2%. I attached the spreadsheets for your use. There is a vertical line in the left hand axis of the SP500 Vs. T-Bill/10yr Treasury Rate Spread chart which you can drag across the chart to help match-up peaks in SP500 with the 0.2% T-Bill/10yr Treas rate spread level. The “Flash Crash” and the “1987 Crash” were not economic events as can be seen in the CAB and the T-Bill/10yr Treas rate spread. Most likely they were computer generated trading events which were ‘human error’. These were likely early algorithms meant to protect portfolios which went amok when unexpected conditions occurred.
(Click on image to enlarge)
(Click on image to enlarge)
(Click on image to enlarge)
The information in this blog post represents my own opinions and does not contain a recommendation for any particular security or investment. I or my affiliates may hold positions or other ...
more

