
S&P 500 Snapshot: Third Consecutive Daily Loss
The S&P opened Thursday above Wednesday's close and rose for the first couple of hours. It was flat for the remainder of the day until dropping within the last hour. The index ended the day with a loss of 0.05%, its third consecutive daily loss.
(Click on image to enlarge)
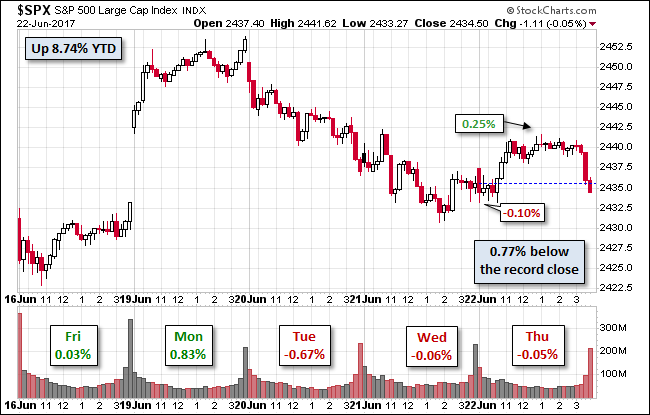
The U.S. Treasury puts the closing yield on the 10-year note at 2.15%.
Here is a daily chart of the S&P 500. Today's selling puts the volume 5% above its 50-day moving average.
(Click on image to enlarge)

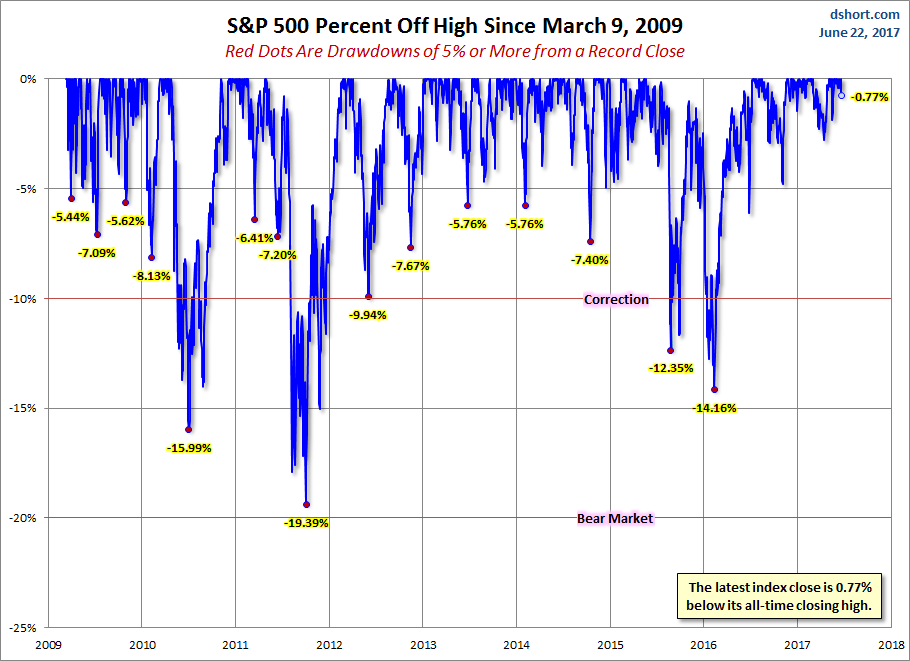
A Perspective on Drawdowns
Here's a snapshot of record highs and selloffs since the 2009 trough.
(Click on image to enlarge)
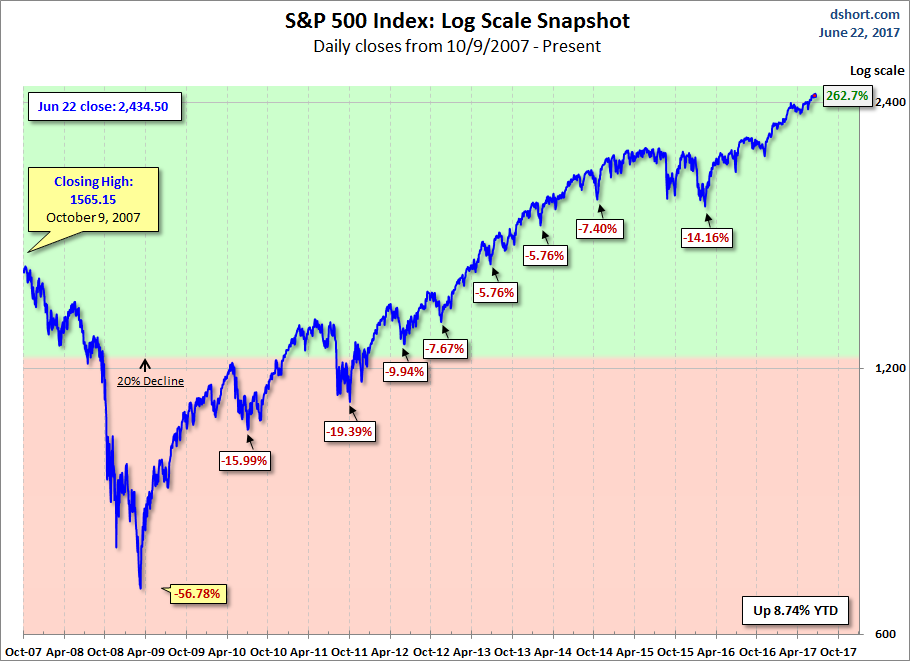
Here is a more conventional log-scale chart with drawdowns highlighted.
(Click on image to enlarge)
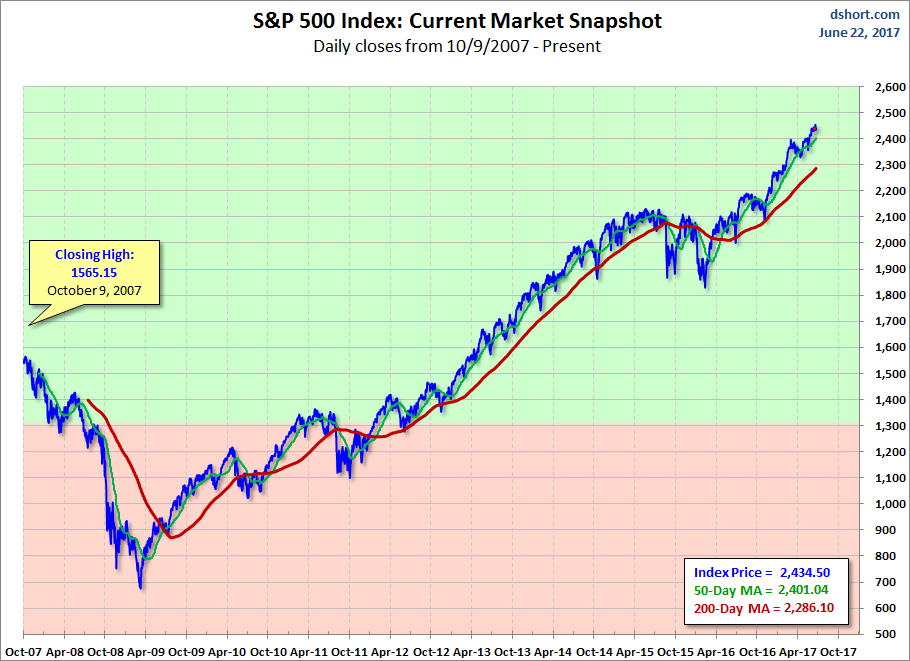
Here is a linear scale version of the same chart with the 50- and 200-day moving averages.
(Click on image to enlarge)
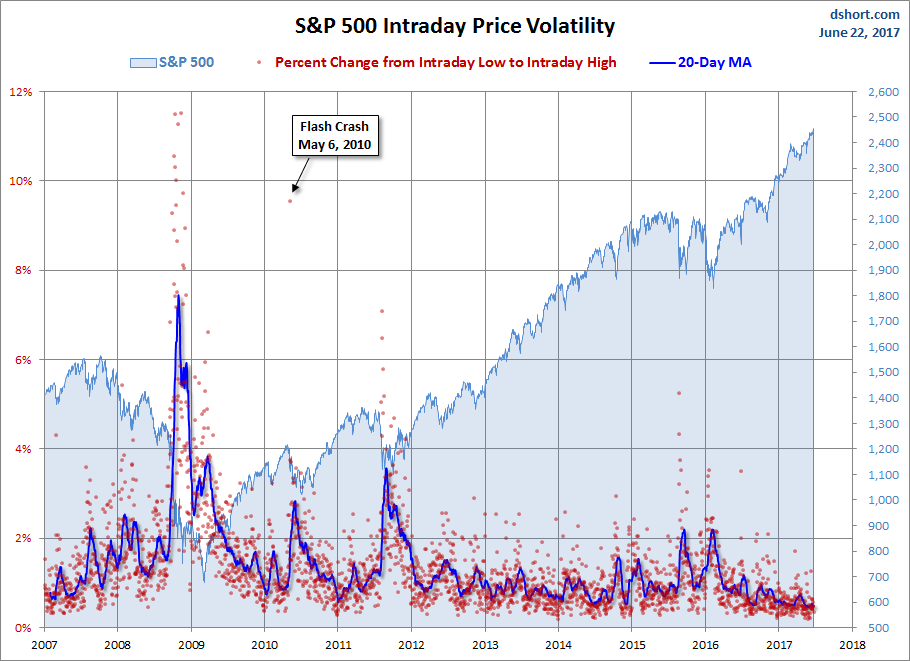
A Perspective on Volatility
For a sense of the correlation between the closing price and intraday volatility, the chart below overlays the S&P 500 since 2007 with the intraday price range. We've also included a 20-day moving average to help identify trends in volatility.
(Click on image to enlarge)
Disclosure: None.


thanks