
S&P 500 Snapshot: Flat Friday, Down 0.97% For The Week
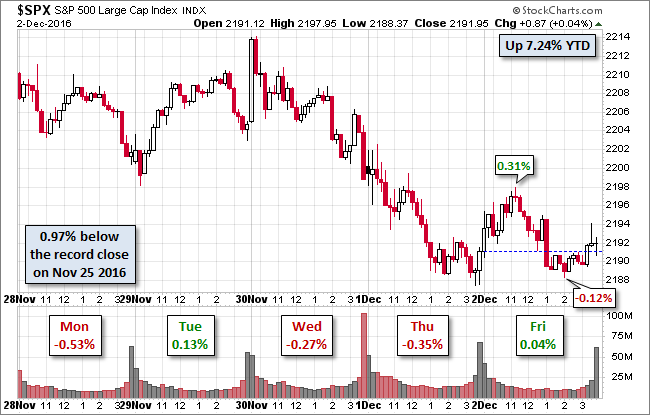
The S&P 500 gave us a modest morning rally to its 0.31% intraday high following a better-than-expected November jobs report. It then sold off to the shallow red at the end of the lunch hour. A bit of buying in the final hour lifted the index to an essentially flat finish (more precisely a microscopic closing gain of 0.04%) and weekly loss of 0.97%.
The selloff in Treasuries took a pause today. The yield on the 10-year note closed at 2.40%, five BPs off its interim closing high set on Thursday.
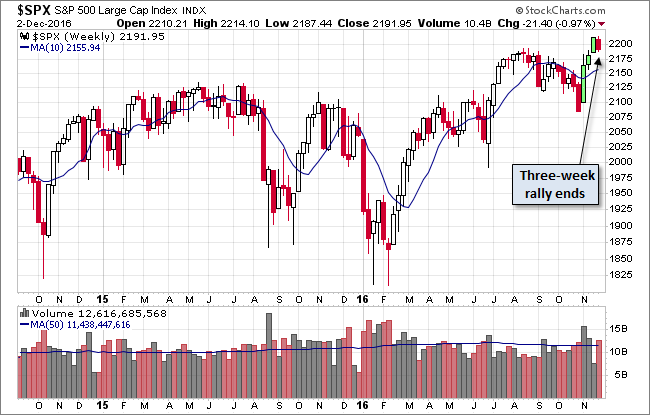
Here is a weekly chart of the index illustrating the three-week rally that ended this week.
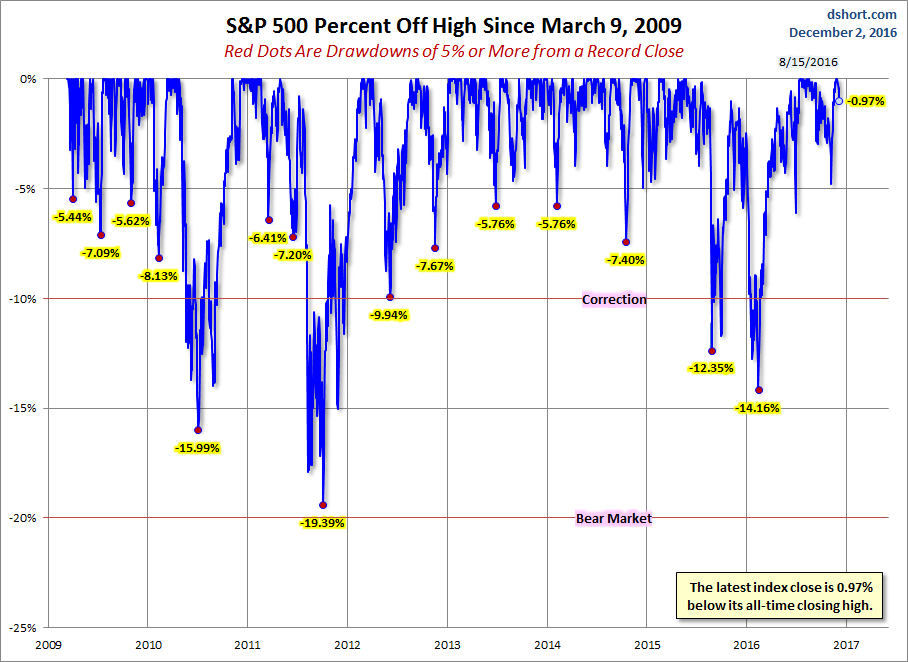
A Perspective on Drawdowns
Here's a snapshot of selloffs since the 2009 trough.
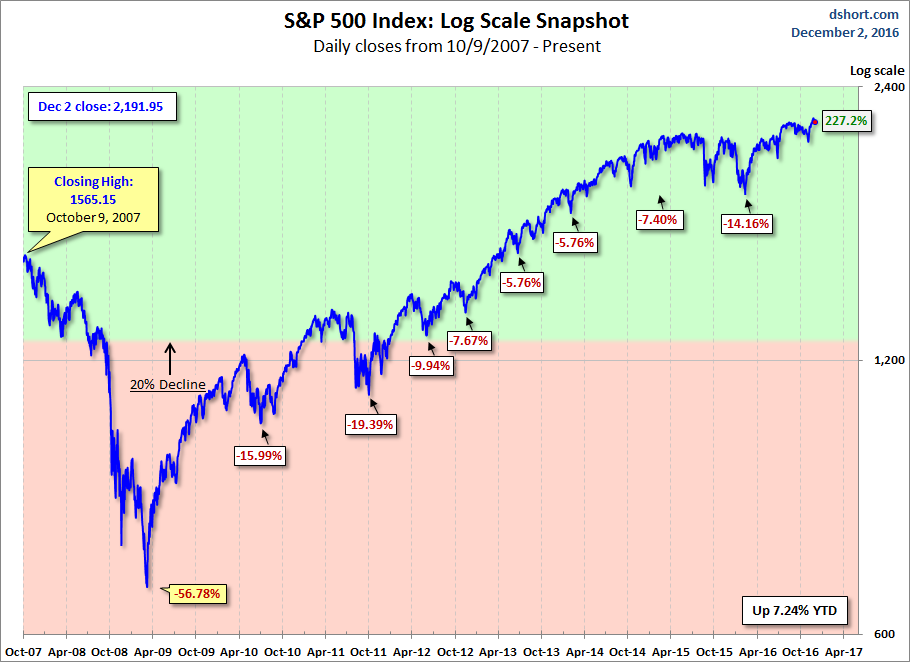
Here is a more conventional log-scale chart with drawdowns highlighted.
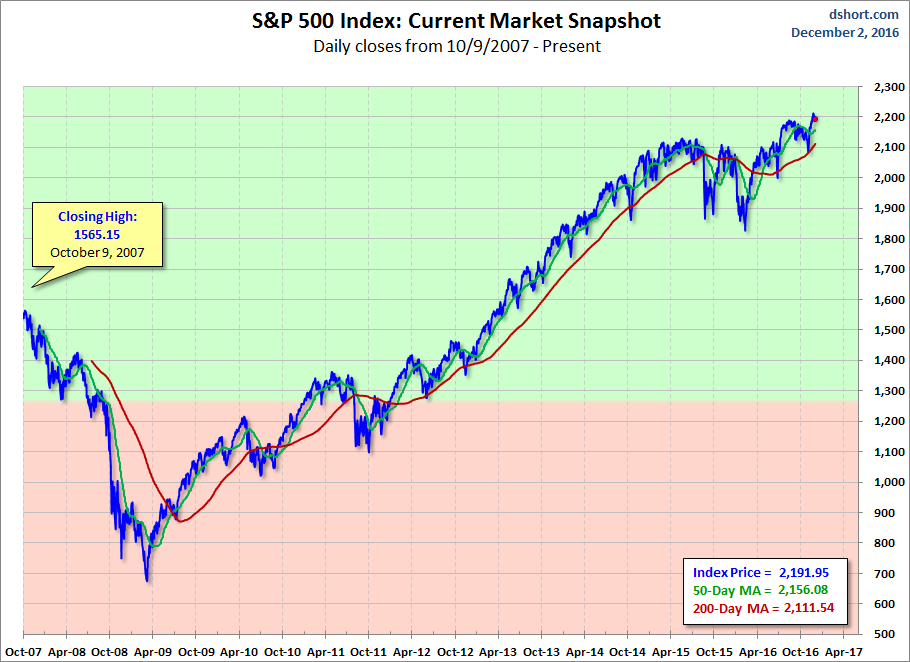
Here is a linear scale version of the same chart with the 50- and 200-day moving averages.
A Perspective on Volatility
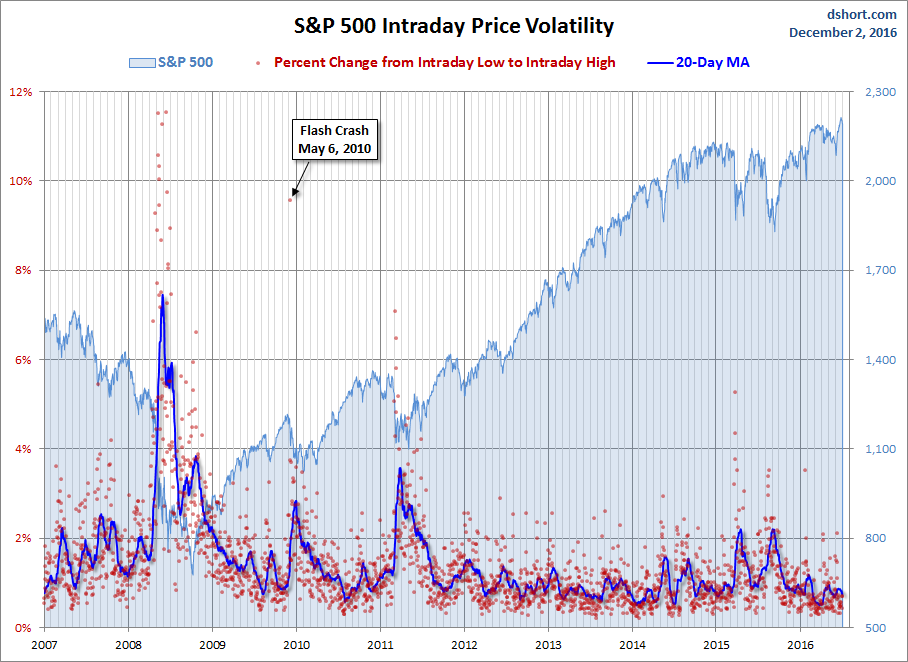
For a sense of the correlation between the closing price and intraday volatility, the chart below overlays the S&P 500 since 2007 with the intraday price range. We've also included a 20-day moving average to help identify trends in volatility.
Disclosure: None.


