S&P 500 Industry Groups Vs 50-Day Moving Averages
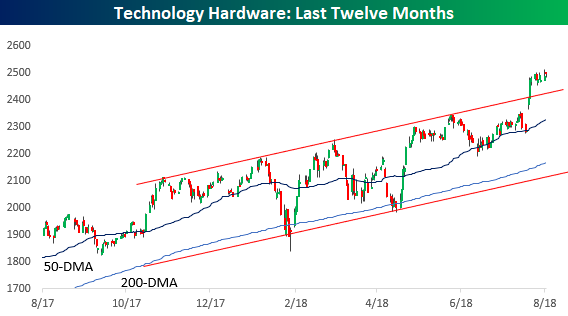
It was a nice day for US markets Tuesday as the S&P 500 broke a streak of four down days in a row and avoided setting the record for the longest losing streak since the 2016 election. The table below summarizes where individual S&P 500 Industry Groups stand on both a YTD basis in terms of performance and relative to their 50-DMAs.Looking through this table, there are a lot of new names at the top compared to what we would have seen earlier in the year. At the top of the list is Tech Hardware, which is up 19.7% YTD and closed today 6.18% above its 50-DMA. The primary driver of this group is Apple (AAPL), and its earnings-related breakout in July pushed the Industry Group up above its trend of higher highs. The group is clearly extended here (see chart below). While Tech Hardware being at the top isn’t much of a surprise, some of the Groups like Food & Staples Retail and Drugs and Biotech are new in terms of market leadership.
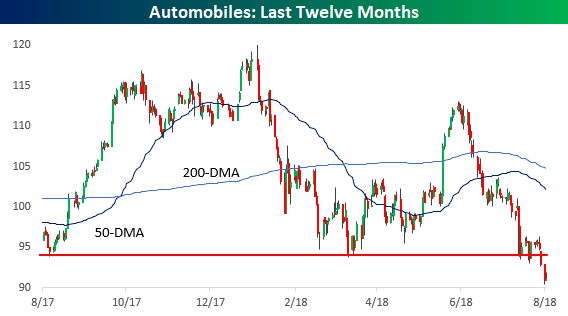
To the downside, just six Industry Groups finished the day below their 50-DMA on Tuesday, and three of them are less than 1% below that level, so one good day for the market could push them back above. Of the remaining three, Energy and Semiconductors (talk about a role reversal; semis lagging the market?) are less than 2.5% below their 50-DMAs, while Autos is bringing up the rear at 8.32% below. A look at the chart of the group shows just an ugly picture as it recently broke down through support to 52-week lows. Also, as we tweeted earlier, it’s not just US names that look bad; on a global basis, the only two that aren’t in downtrends are Tesla (TSLA) and Suzuki (SZKMY).
(Click on image to enlarge)

(Click on image to enlarge)
(Click on image to enlarge)