
S&P 500: Home On The Range
Another day on the range. Last week, we had hoped the outcome from the BoJ would break the S&P 500 free by sparking global market volatility. Not the case, as neither was it on Wednesday with the outcome from the FOMC.
Where does this recent range stand historically? We have it calculated, by looking at the distance between the high and low of the past 10 days in the S&P 500 cash index, that the current range of only 0.91% is the smallest since the early 1960s.
So, don’t sweat it if you are finding the trading tough. Take a step back, if need be, volatility will return and the market will move once again. Keep your powder dry for when it does…
What will be the catalyst? Who knows, it could simply be price movement spurred by more buyers than sellers, or vice versa. Markets can move without a significant single event; people often forget that.
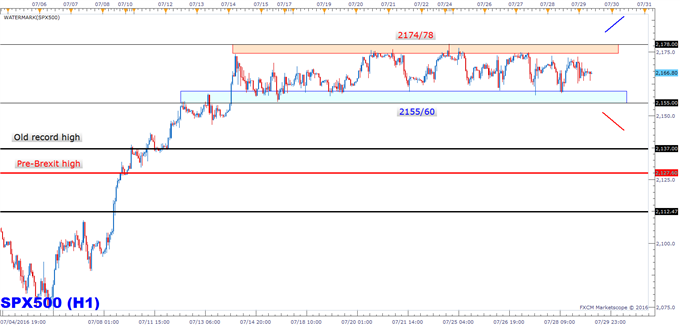
So it is, the upper and lower-bounds are the same again – resistance is 2174/78, while support is 2160/55. But even when we do make a break for it be careful not to get caught into a trap. On this end, the preferred way to make a play at this time is to wait for a break and a retest of broken support/resistance or a counter-trend move, at the least, before entering.
Below is the same chart as Friday, only a little more elongated...
Disclosure: None.
Disclaimer: Forecasts which are made in the review constitute the personal view of the author. Commentaries made do not constitute trade ...
more

